What is Data Fabric?
Data Fabric lets users access & manage data from multiple external sources through a single, unified layer. This unified layer can be consumed across UiPath platforms for Automations, Process Orchestration, Low-code App development, AI Agents


Design Process
DISCOVER
DEFINE
IDEATE
DESIGN
TEST
Learn about users
through testing
Testing creates
new ideas
Learn from prototypes
to spark new ideas
Test reveals insights that
redefine the problem
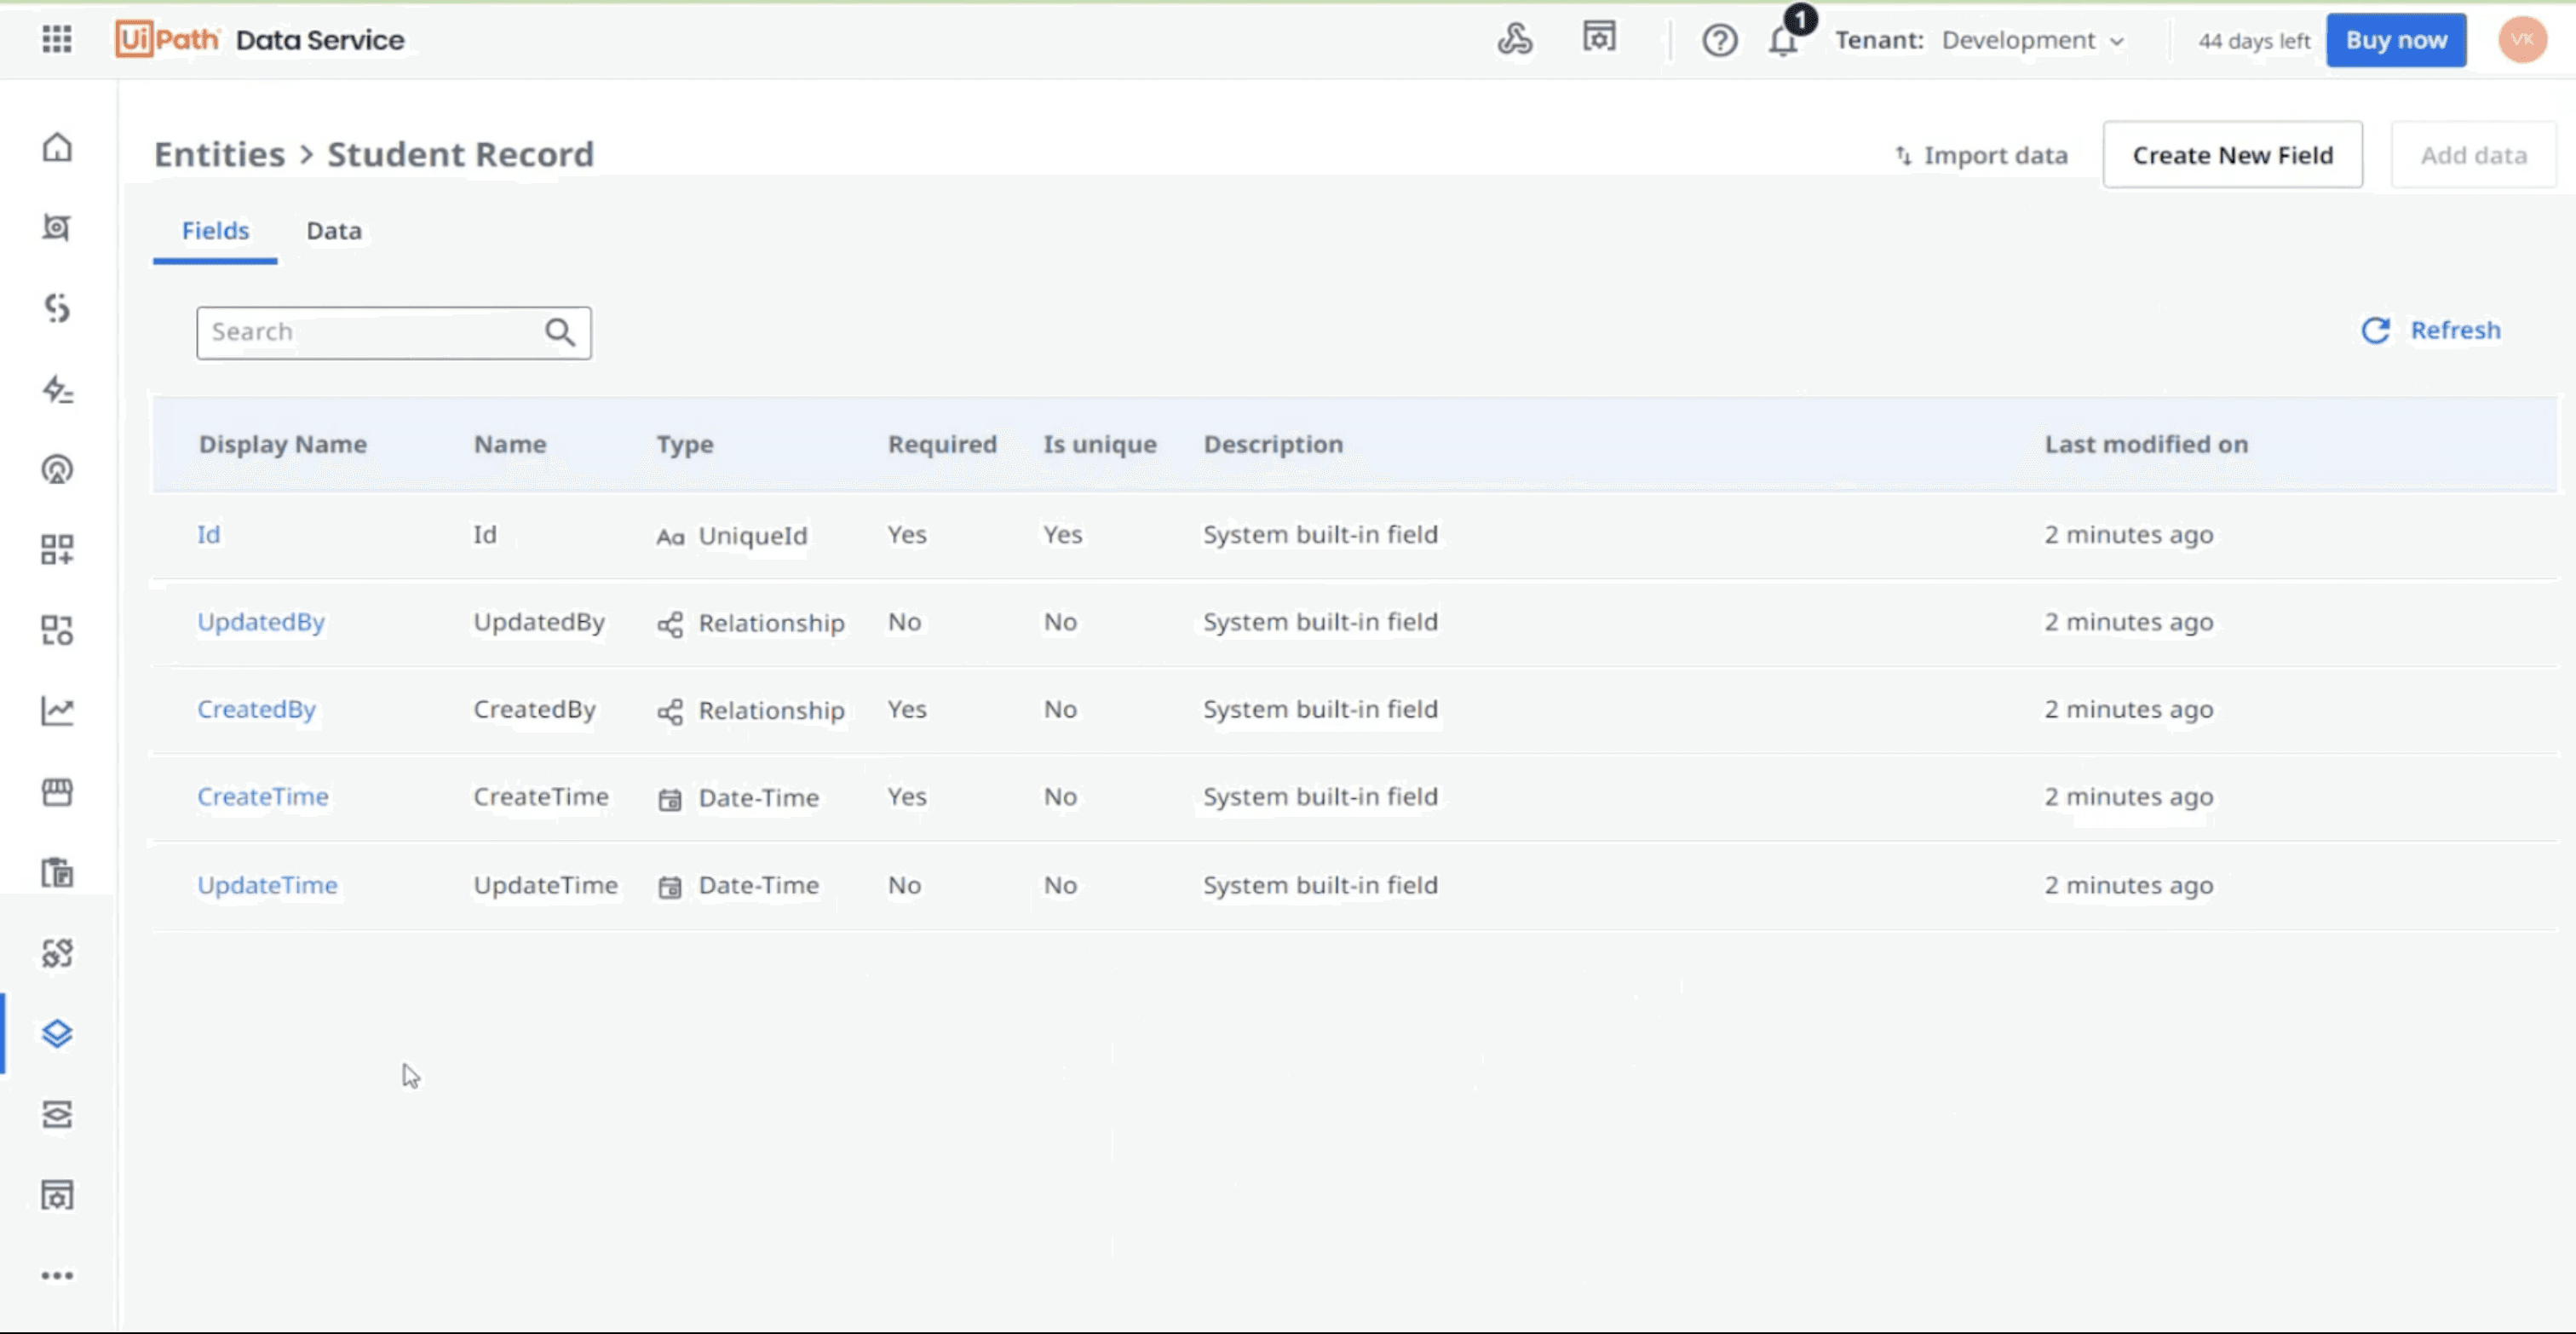
Understanding the existing product - Data Service
Data Service was UiPath’s internal database for storing and managing structured data, limited to native app data without external integrations. Our goal was to revamp Data Service to Data Fabric.
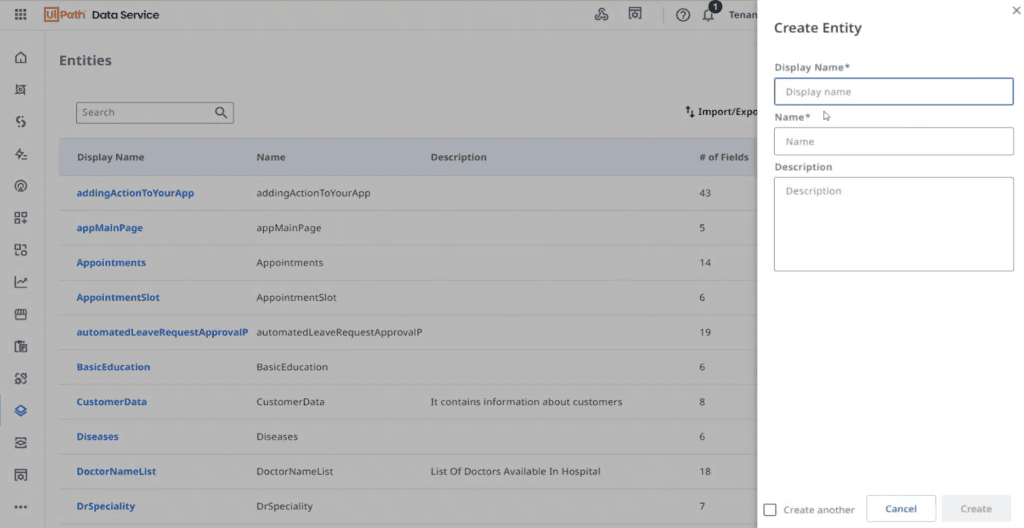
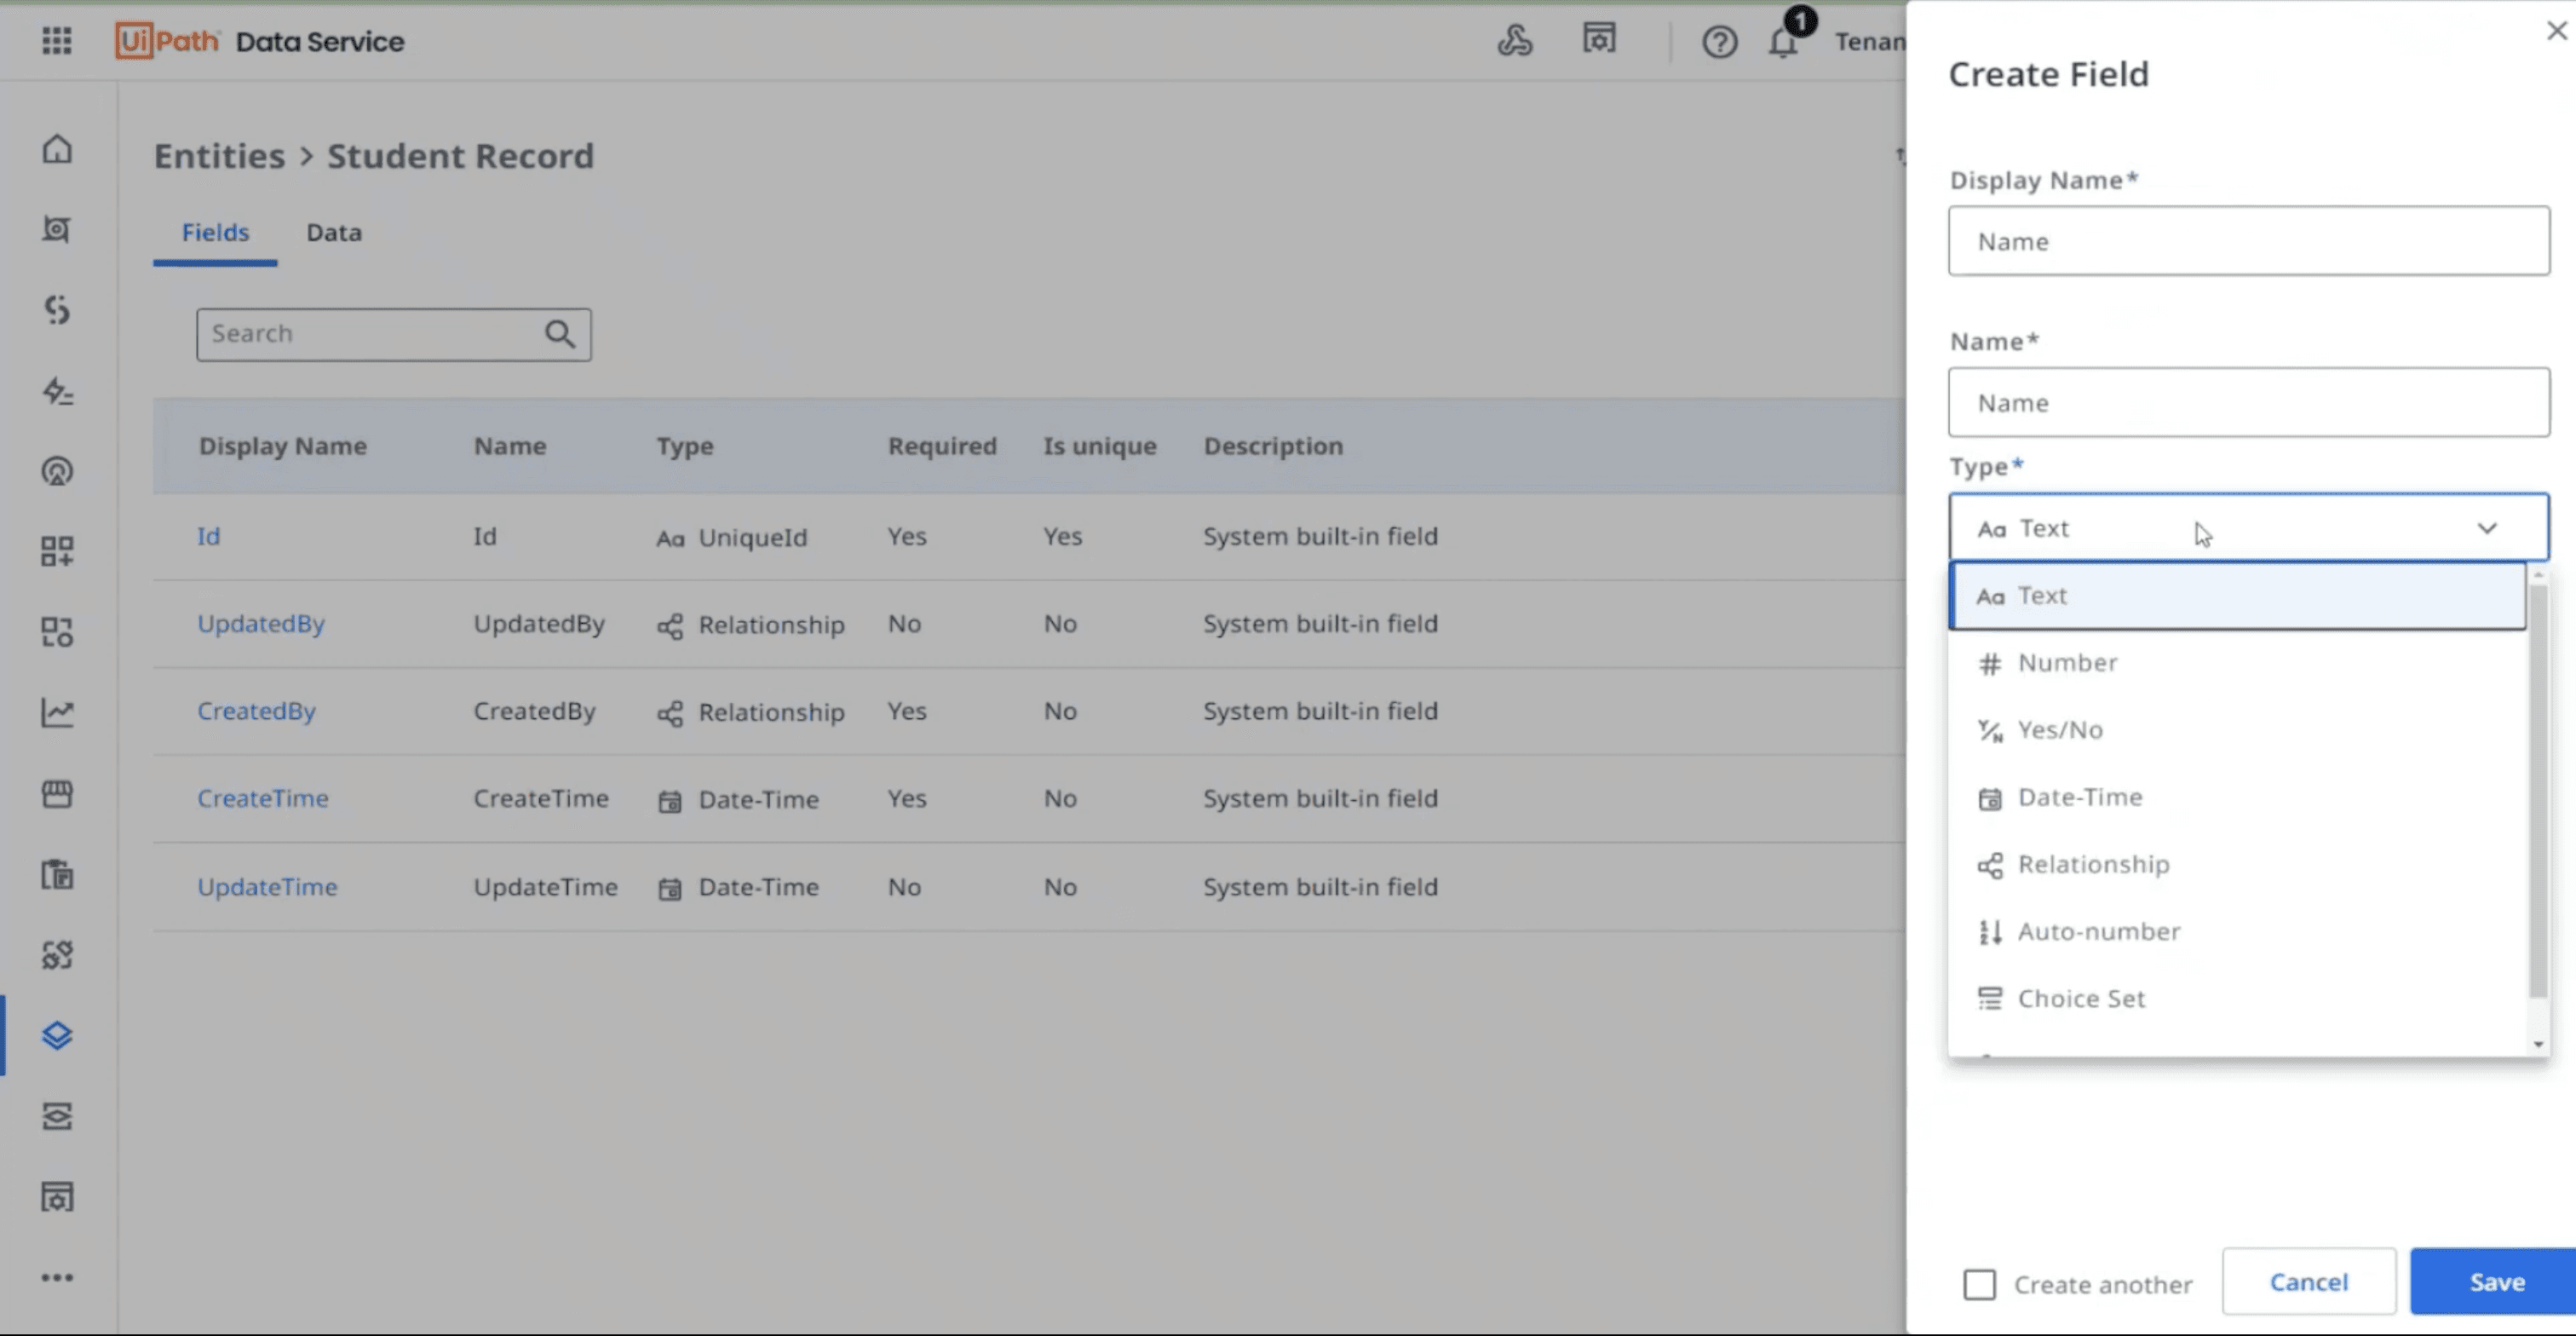
Data Service
Core Features
No-code entity creation & relationship modeling
CRUD operations via UiPath Studio
Seamless integration with UiPath Apps & Automation
Secure, scalable cloud storage
Why the 'Revamp'? - Insights From Users
User Pain Points
No external data source connectivity
No unified view across systems (internal & external)
Flat relationships: Couldn’t model multi-level relationships (e.g., customer → orders → items).
No real-time sync → data often outdated
Navigation and workflows are not intuitive
“
“
We want a centralised layer for inventory management where customer data is coming from Salesforce, inventory data from SAP and shipment data - that can be stored locally
“
“
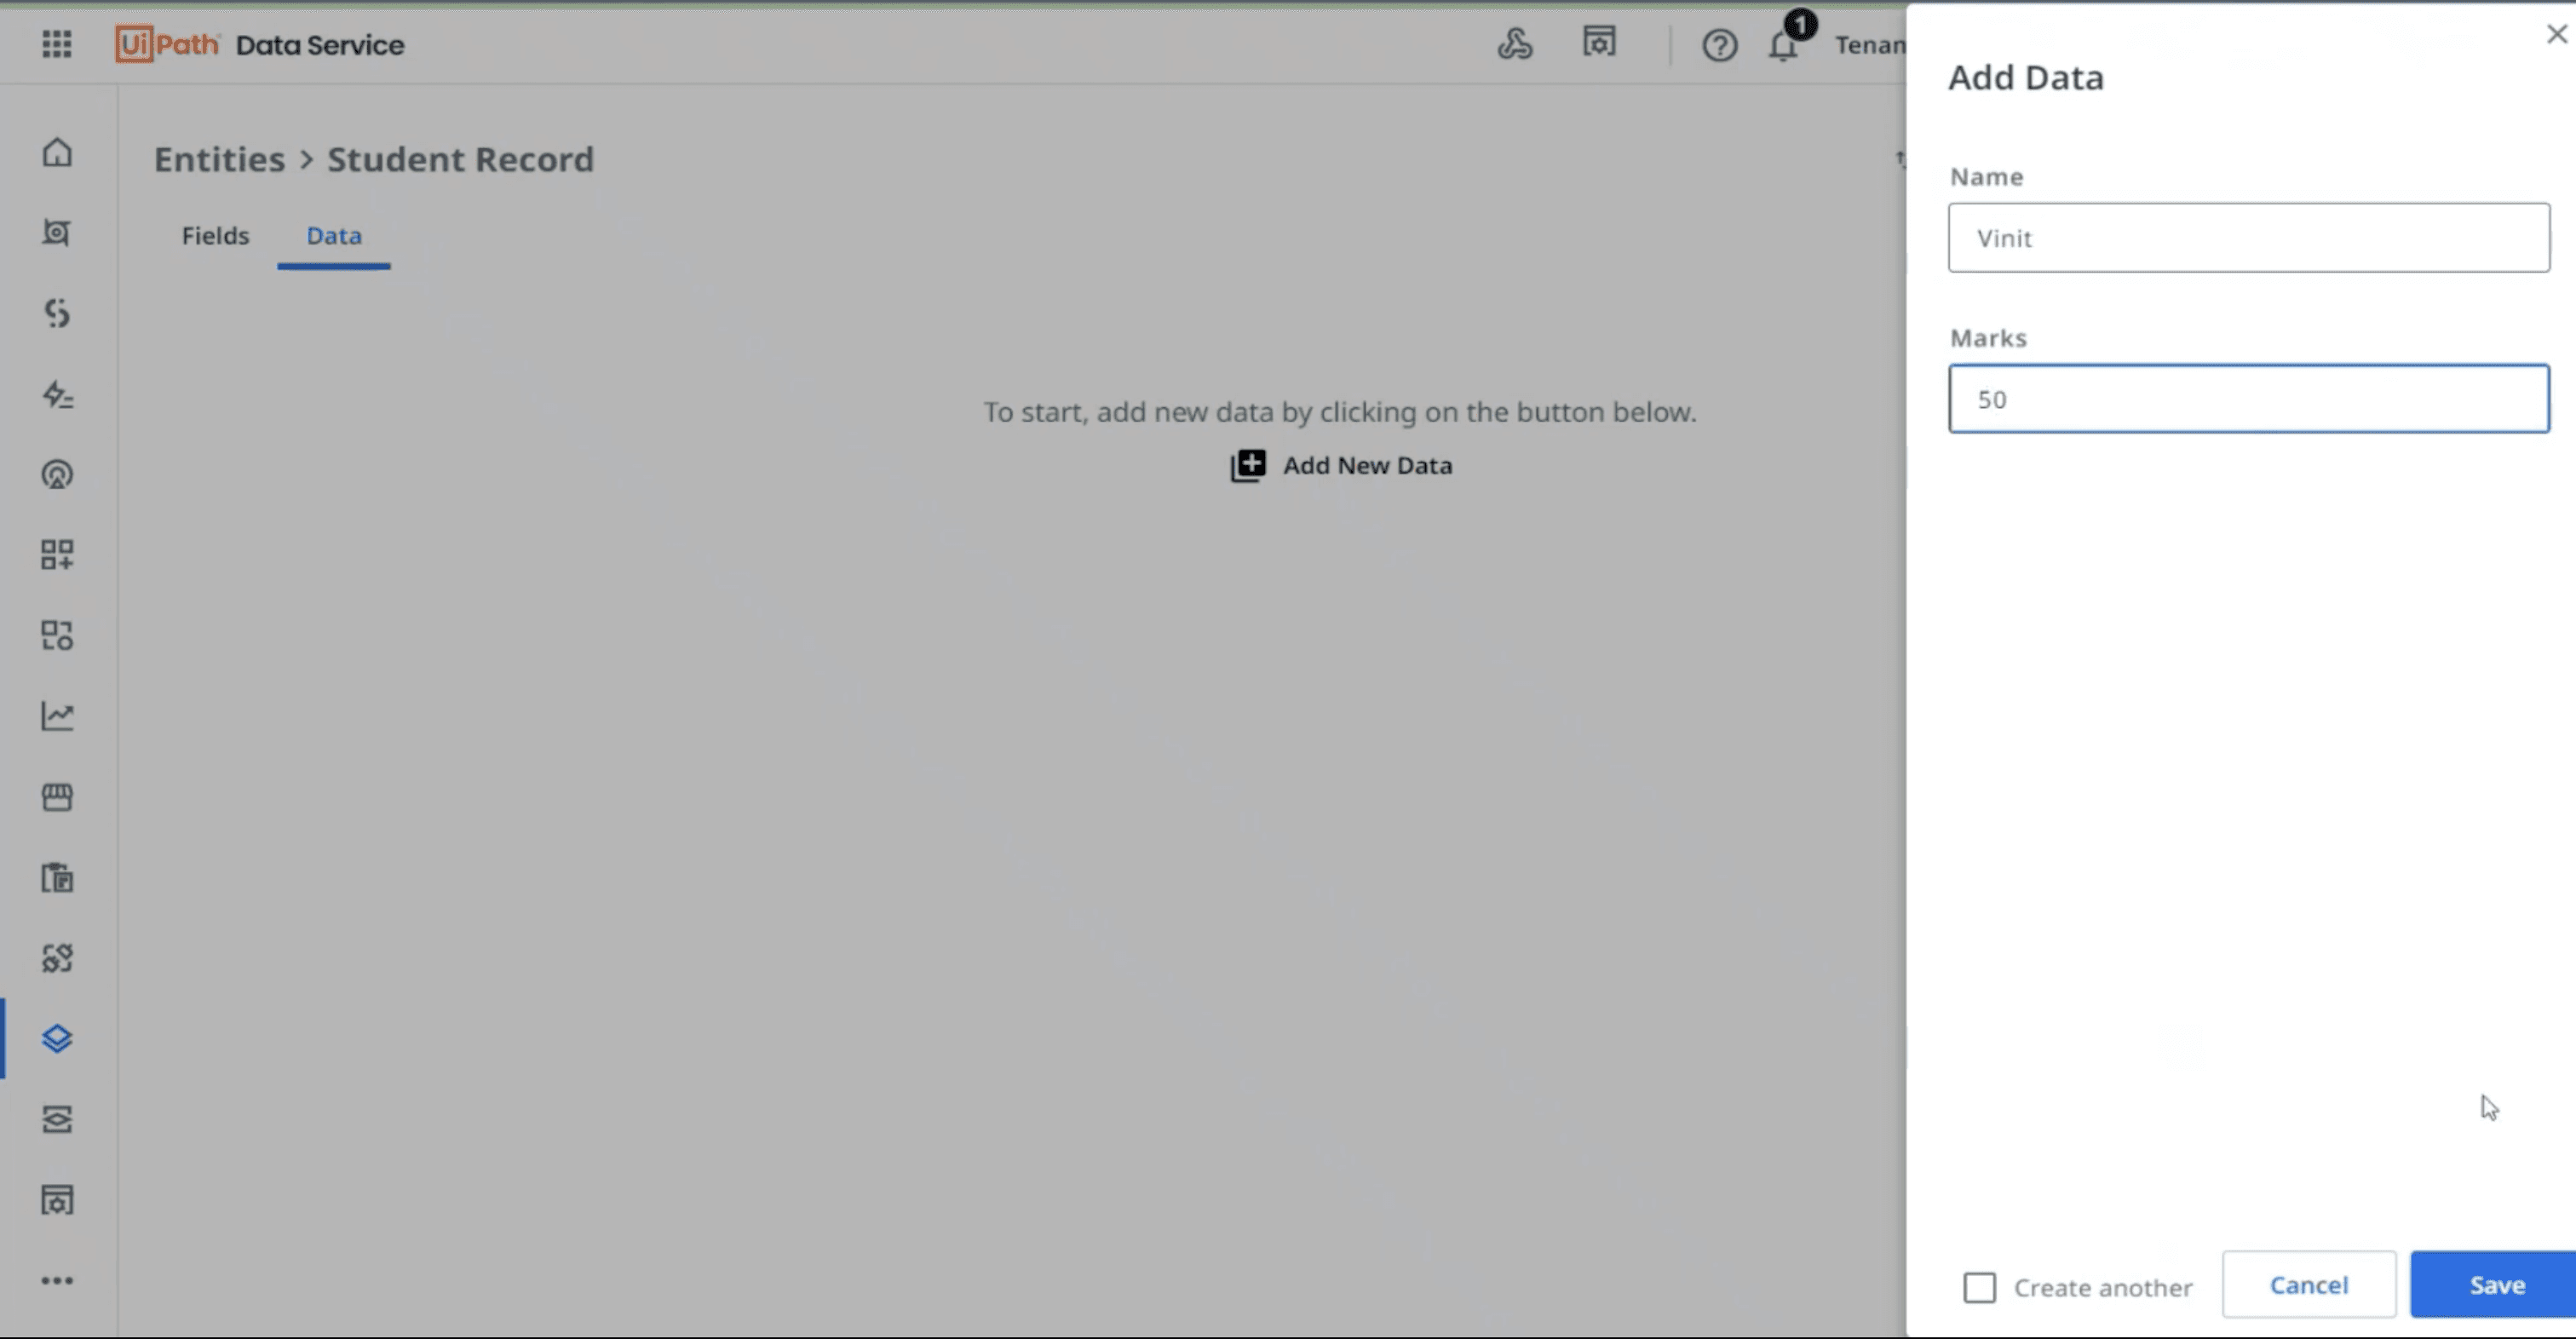
Creating fields and then adding data locally takes a lot of time. Importing data from excel is fine but it’s like copy-pasting
Goals
Avoid scattered data: Many used spreadsheets, assets, or local files - making data hard to manage and reuse.
Ensure data governance: Centralizing automation data was key for security, access control, and compliance.
Connect external systems: Seamless access to enterprise data like Salesforce or other databases.
Real-time previews: See the effect of mappings/queries instantly before publishing.
Understanding the end-to-end ecosystem
Local object
Physical Layer
Ex Object 1
Local object
Ex Object 2
Physical Layer
ENTITY A
Logical Layer
ENTITY B
TASK 1
ENTITY A
ENTITY B
TASK 2
AGENT
Blueprint of a business process
Conceptual Layer
Automations / BPMN
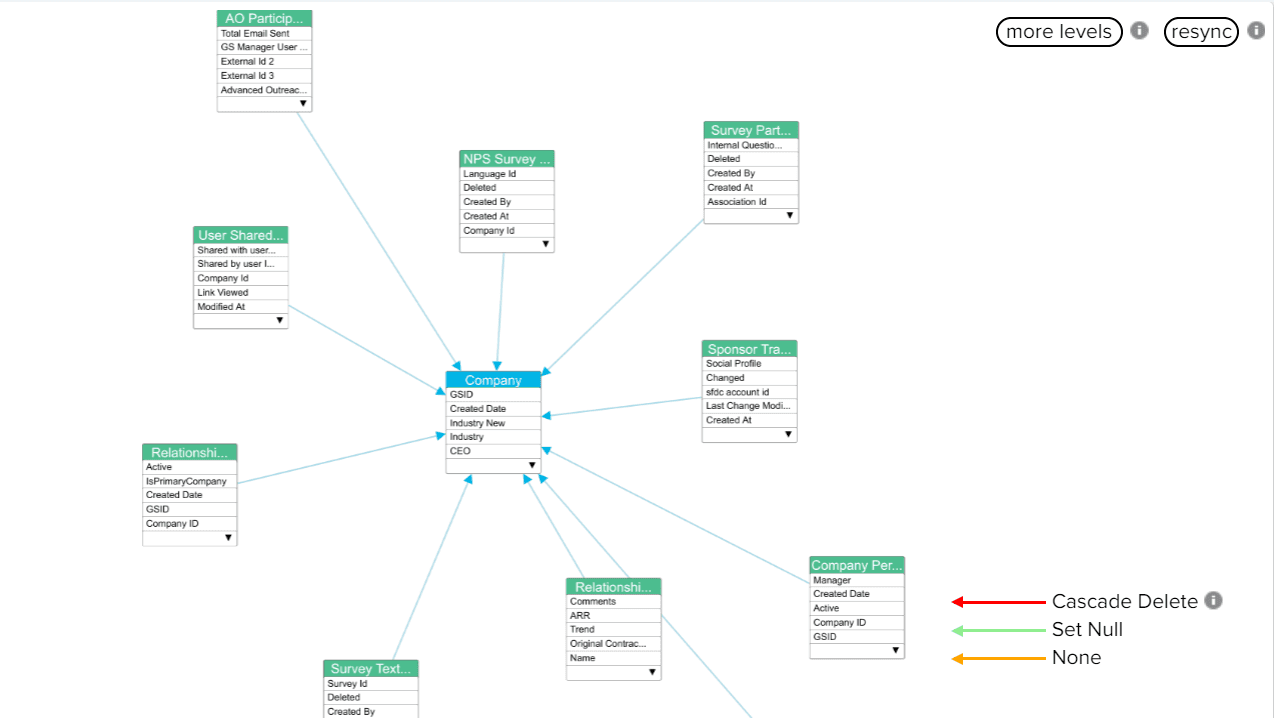
Entity view
Data Fabric
ENTITY 1
Employees
Shipment
Inventory
Employees
ENTITY 2

Inventory
Employees
Shipment
ENTITY 3
Inventory
Entity 1
Tickets
ENTITY 4

Types of Entities
Entity
External fields
Local fields
User Personas

Satya
Automation Solution Architect
Age: 35
Location: Bangalore
Work Experience: 6+ Years
Gender: Male
Personality
Detail-oriented, strategic thinker, collaborates with cross-functional teams
Pain Points
Switching between apps & data sources
No transformation logic
Unable to visualize data
Tech Skills
UiPath Studio
Orchestrator
Python
C#
Needs from Data Fabric
Ability to visualise entities
Easy integration with apps & automation workflow
Secure and centralized data access
Goals
Design robust automation systems
Ensure scalable architecture
Reduce development time

Mitchelle
Automation Developer
Age: 26
Location: Bangalore
Work Experience: 3+ Years
Gender: Female
Personality
Fast-paced, focused on delivery, leans on visual tools to save time
Pain Points
Complex data modeling with limited visibility
Scattered Data Sources
Tech Skills
UiPath Studio
ReFramework
VB.NET
REST APIs
Goals
Build fast and efficient workflows
Reuse components
Deploy with fewer bugs
Needs from Data Fabric
Pre-modeled entities
Faster processing time
Low-code access to complex data
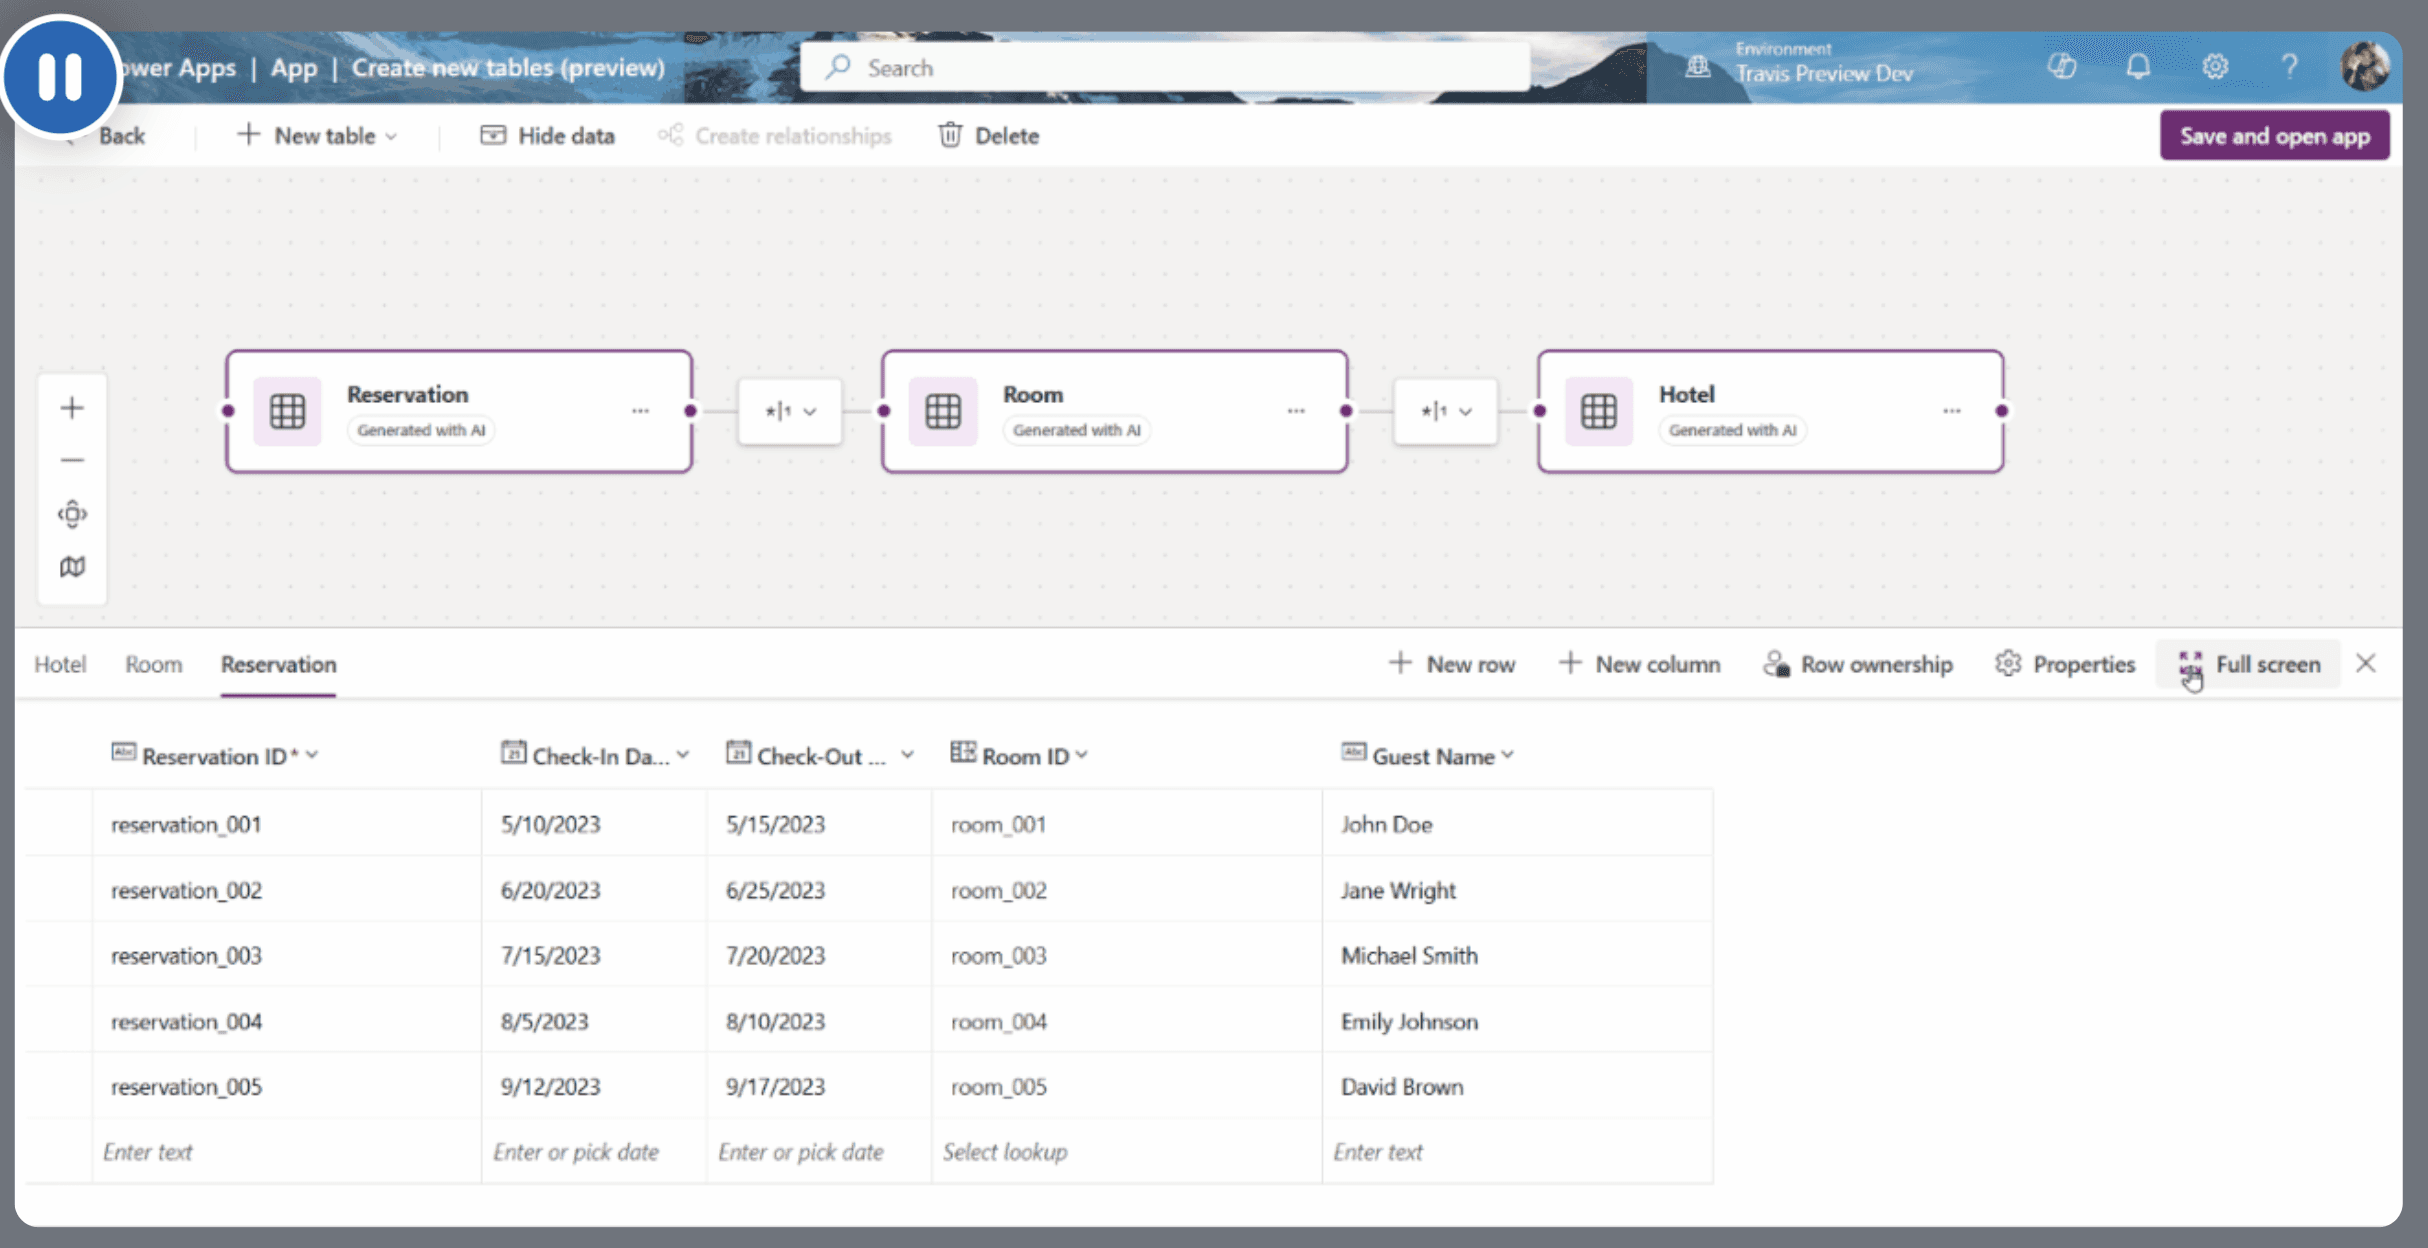
Defining the core workflows
Create entity
Add virtual
tables from
external source
Add table from
existing internal
sources. Eg:
Orch, Studio
Live data preview
of virtual tables
Create table
locally
Connect to
data source
Eg: Salesforce
Select tables
from Salesforce
Select columns
& map data
Display virtual
tables on the
canvas
Create data
models -
define joins
Test and
publish
Edit virtual tables:
Table properties,
column props +
add columns
User flow
End-to-end user journey
Identify the business
process to be improved
Business docs
Process owner /
business analyst
Identify resources needed
Solution design
Solution architect
Identify required data
Data inventory
Solution architect
Create entity / Add data
Data fabric
Solution architect
Consume data
Studio, AO, Agent Builder,
Apps, Process mining, DU
Developer
Manage data
and connections
Integration controls:
connection & permissions
Solution architect,
Developer
Measure usage / impact
Data quality insights:
missing data, duplicate
data, outliers
Governance
Compliance logs:
governance, audits
Developer /
CoE manager
ASSESSMENT
BUILD
MEASURE
ACTION
TOUCHPOINTS
PERSONA
CONSUME
MANAGE
AUDIT
DATA FABRIC
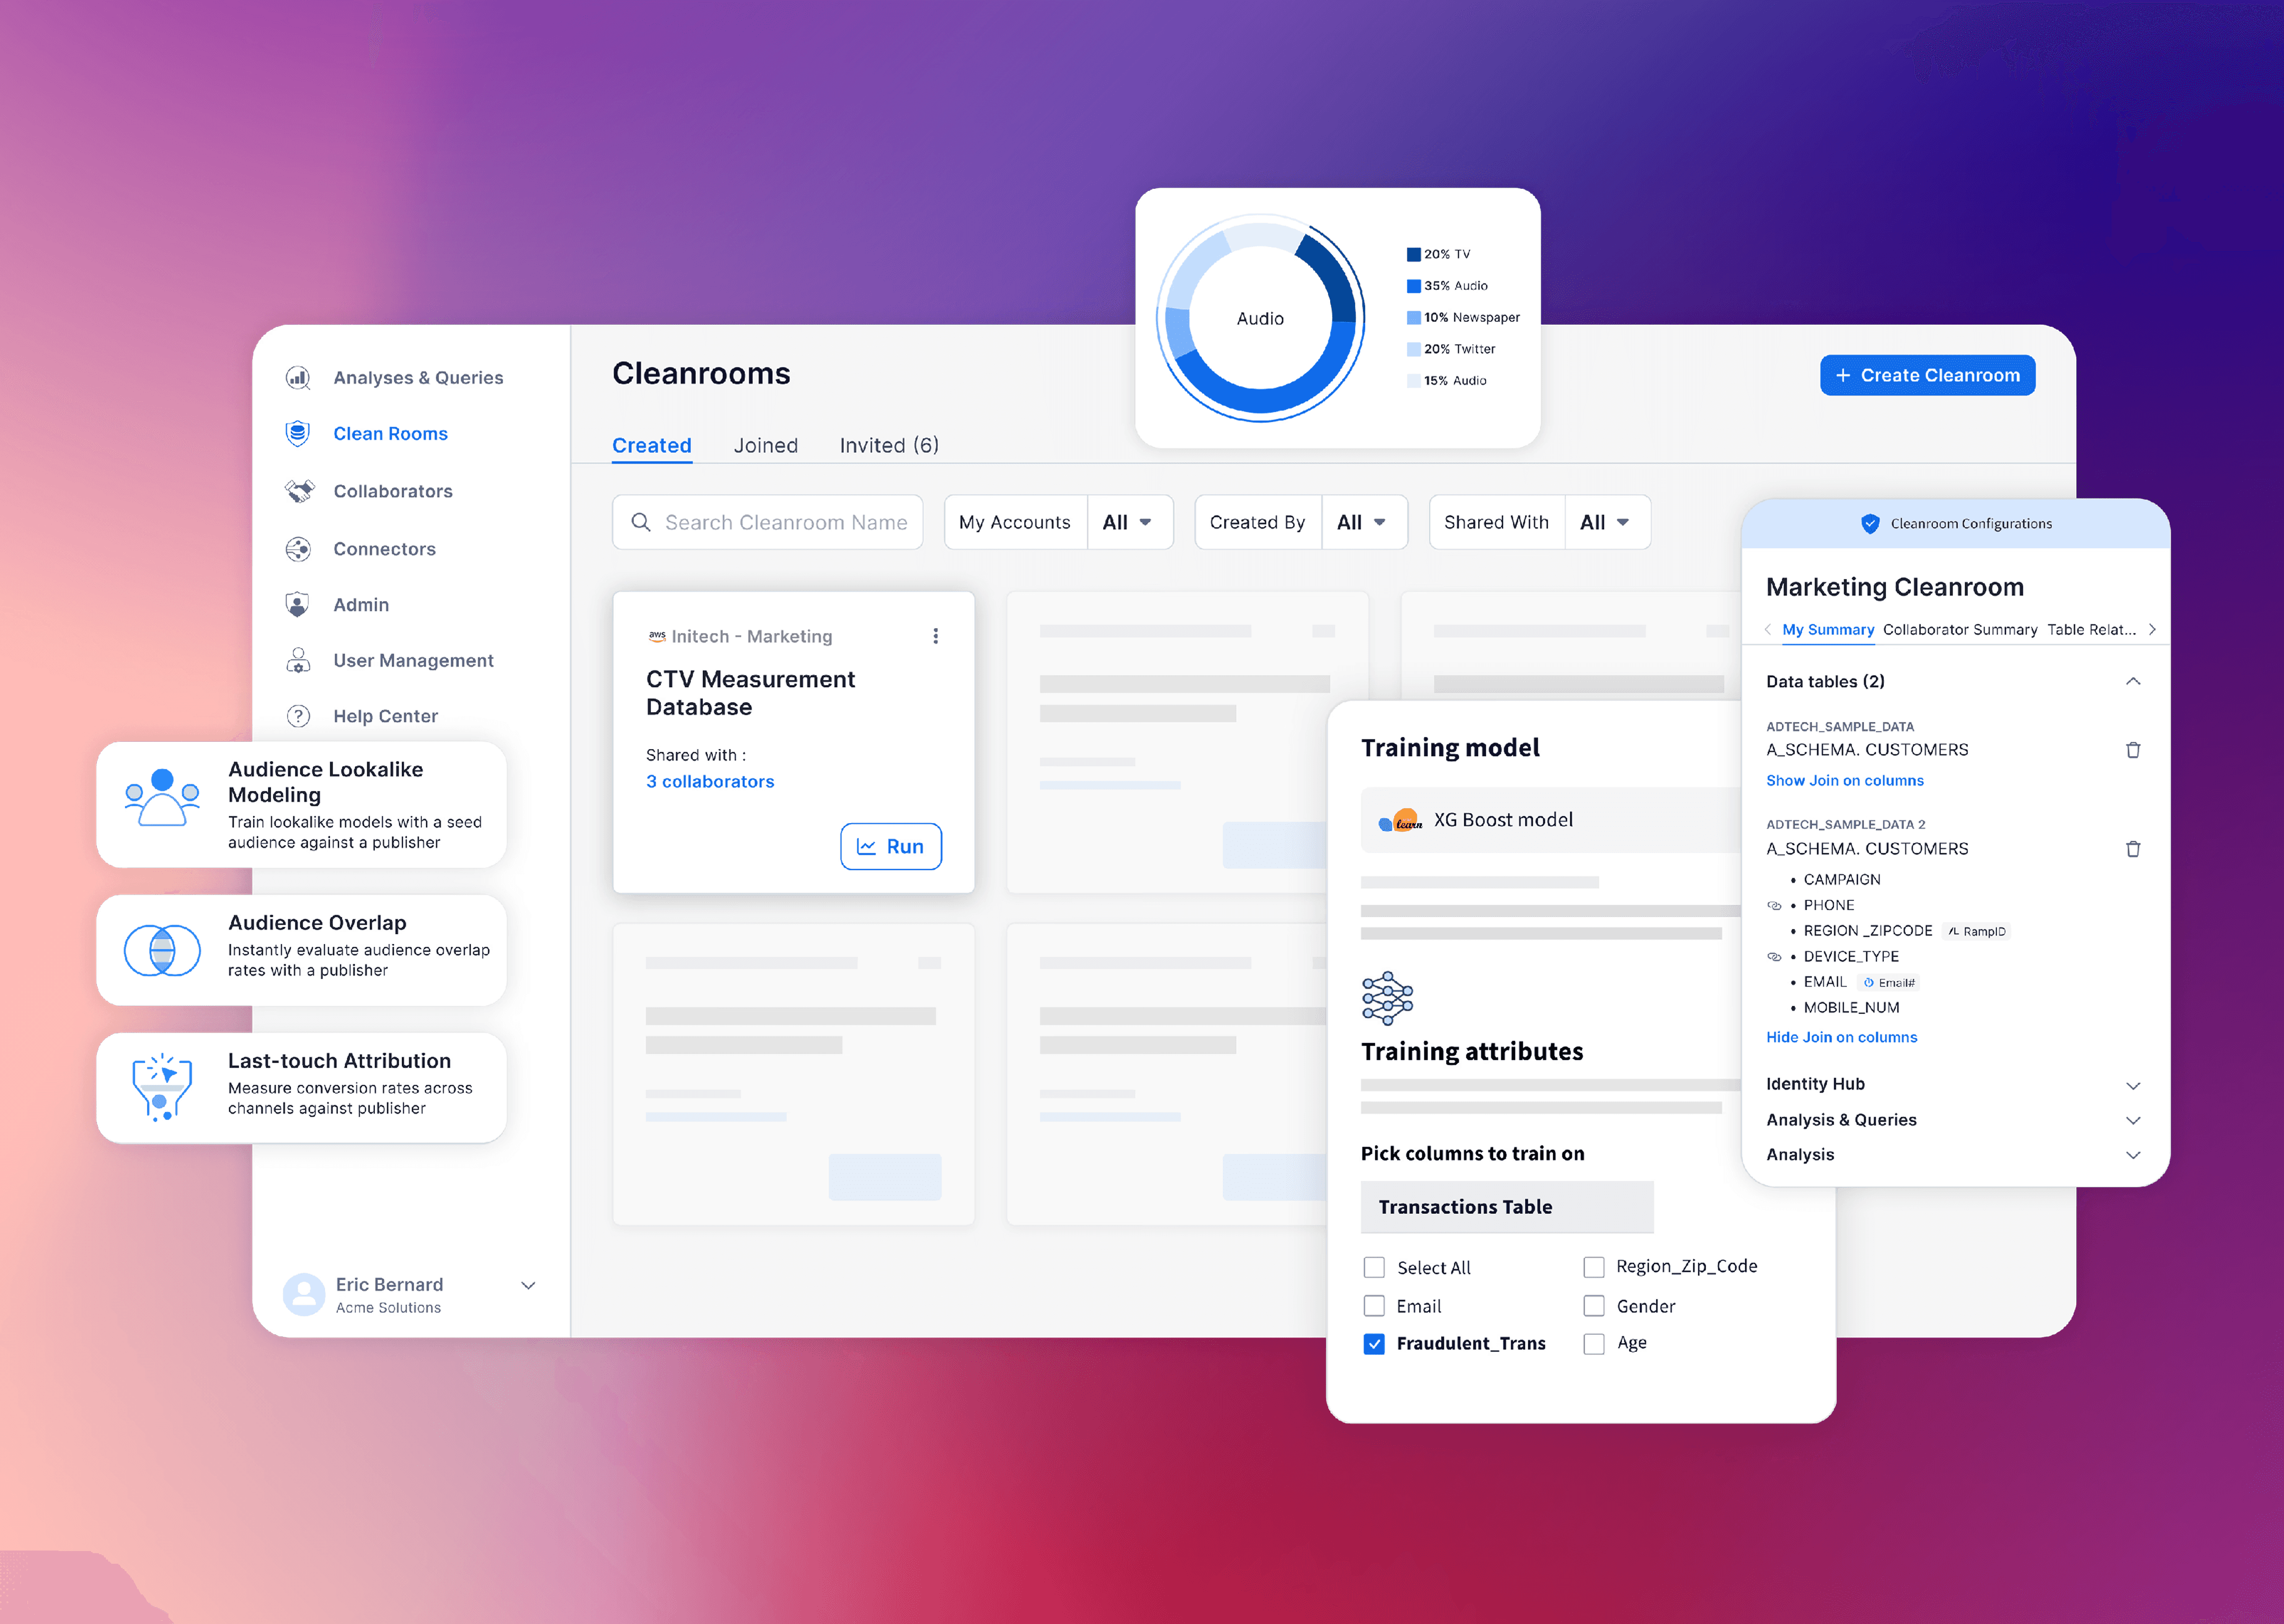
Approach #1 (private preview)
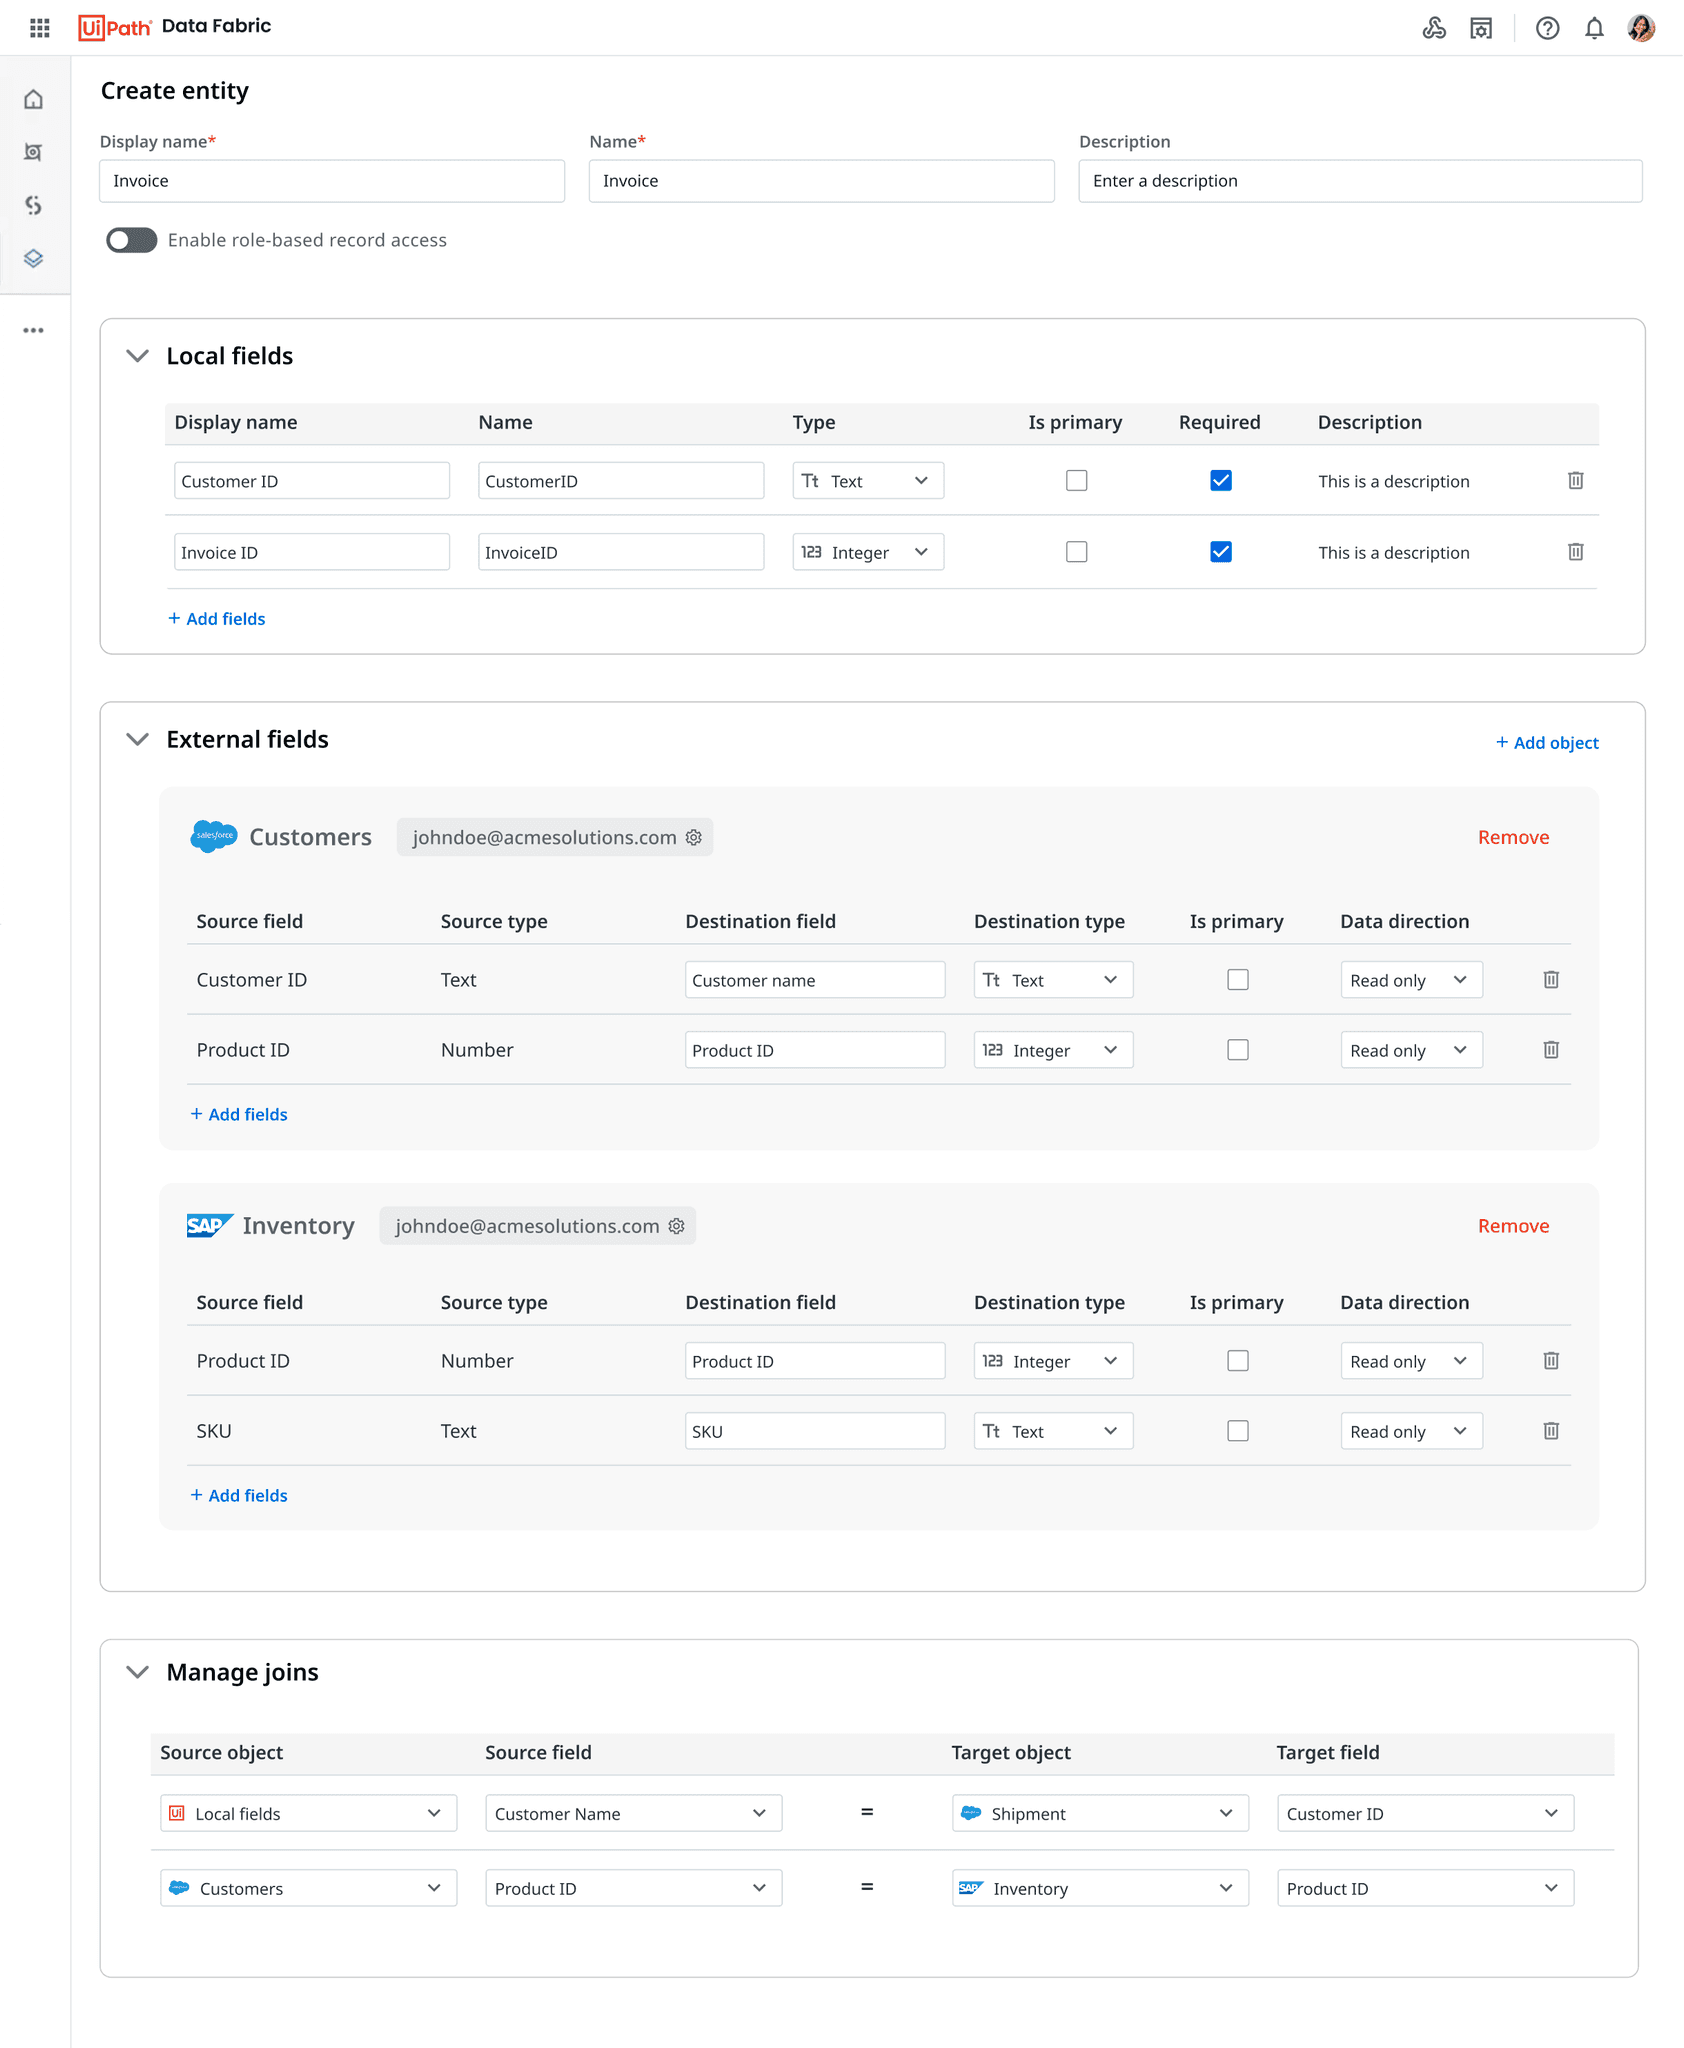
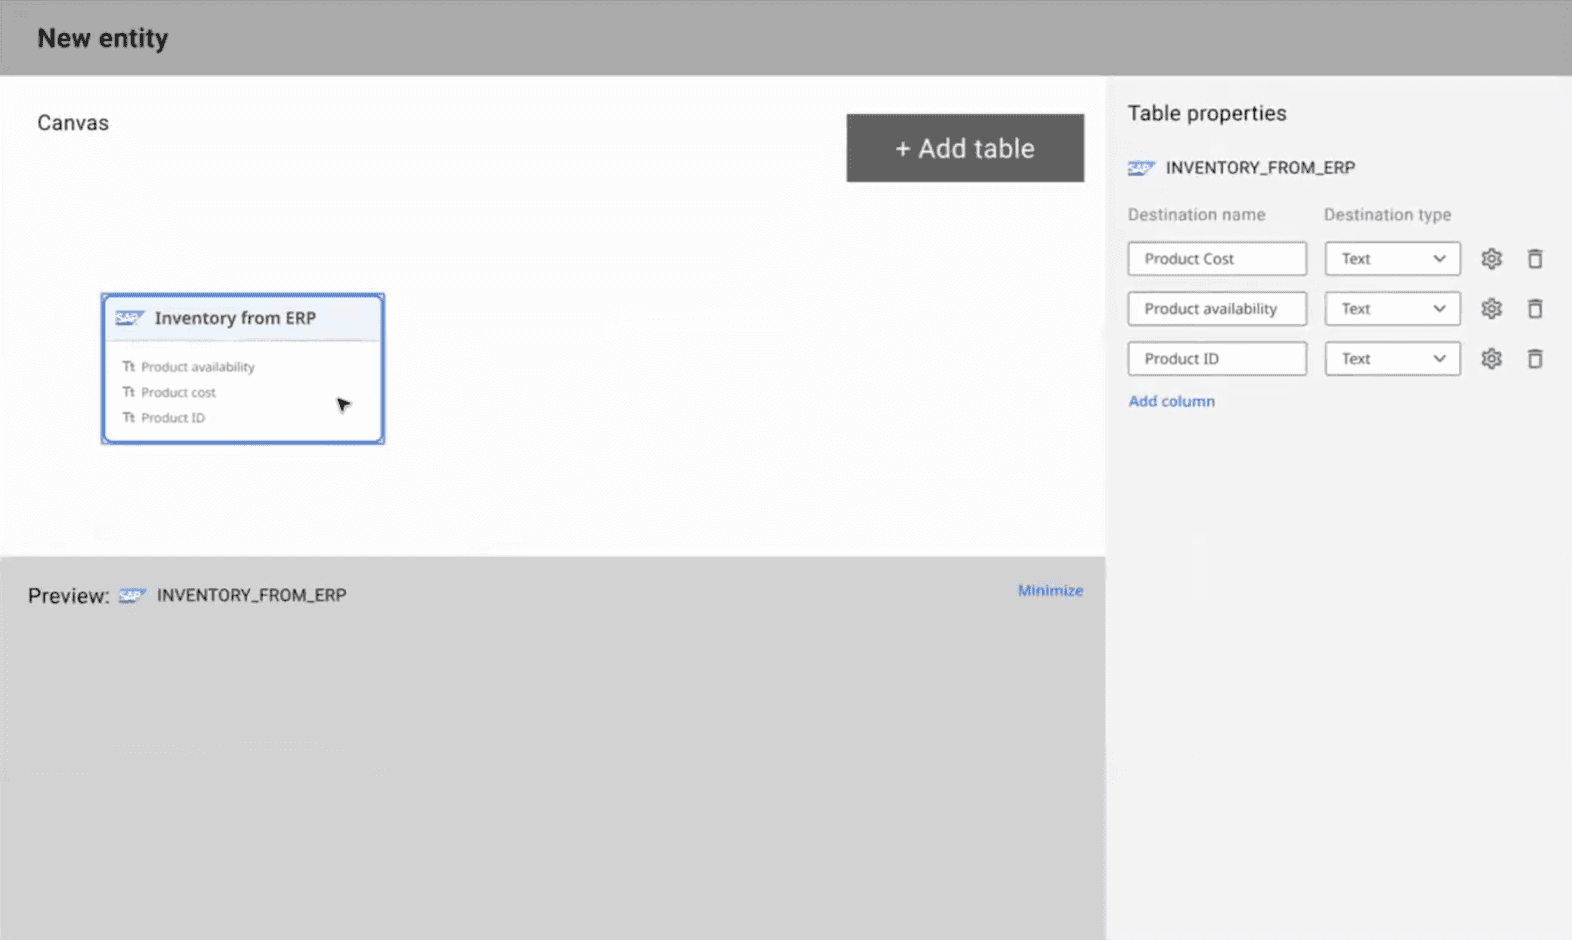
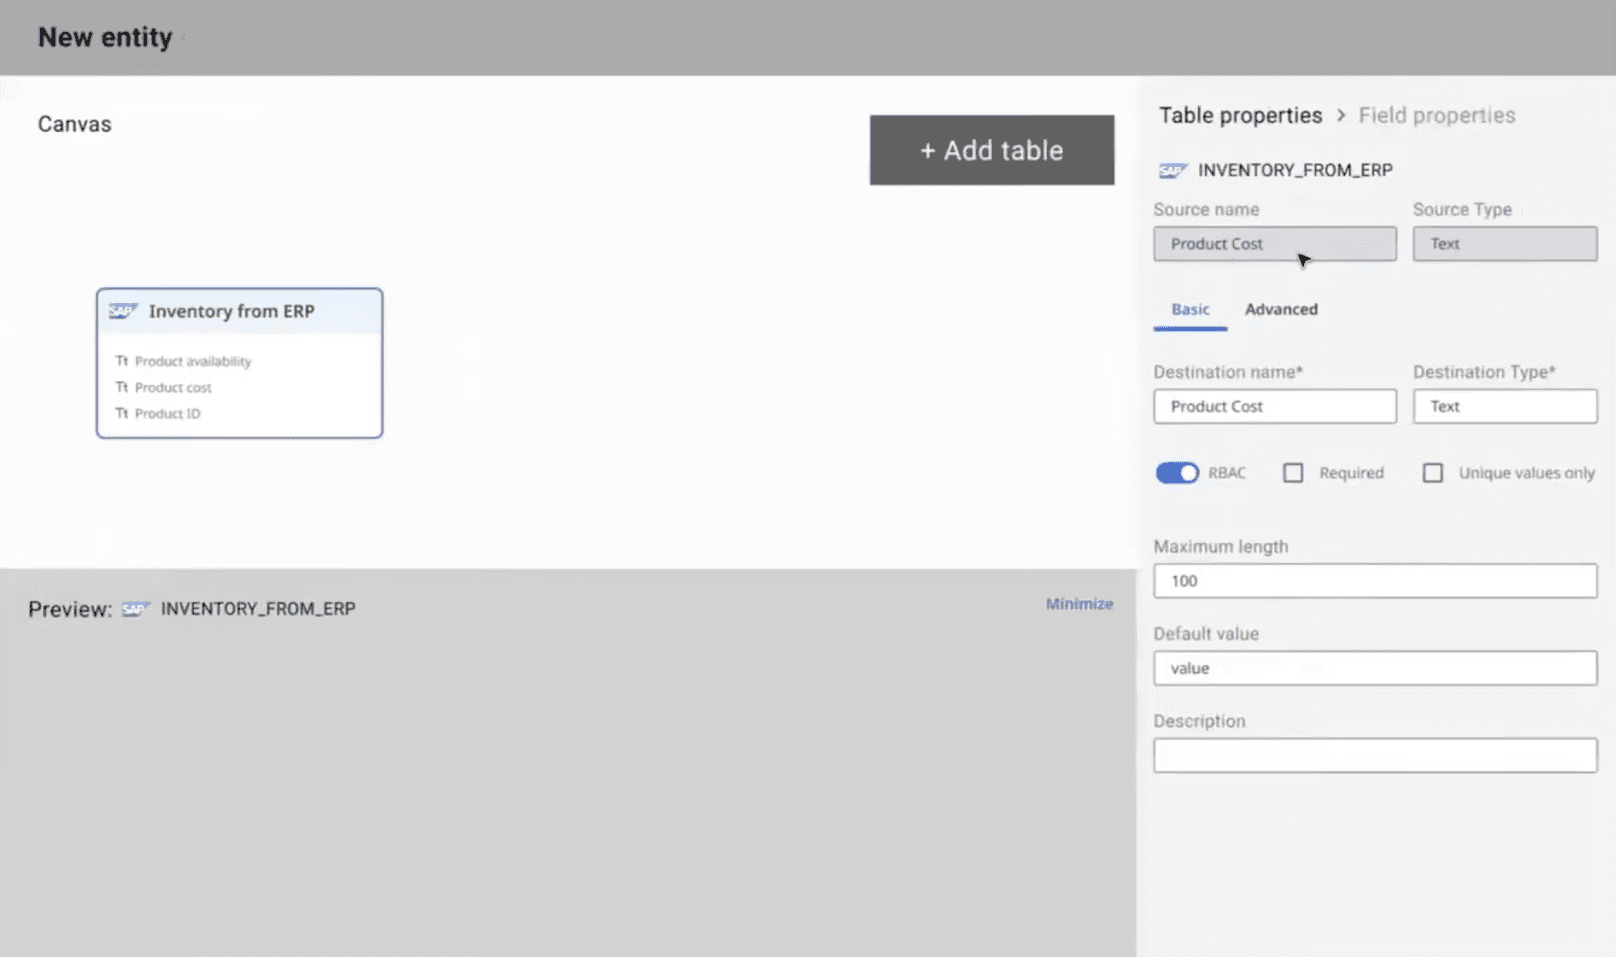
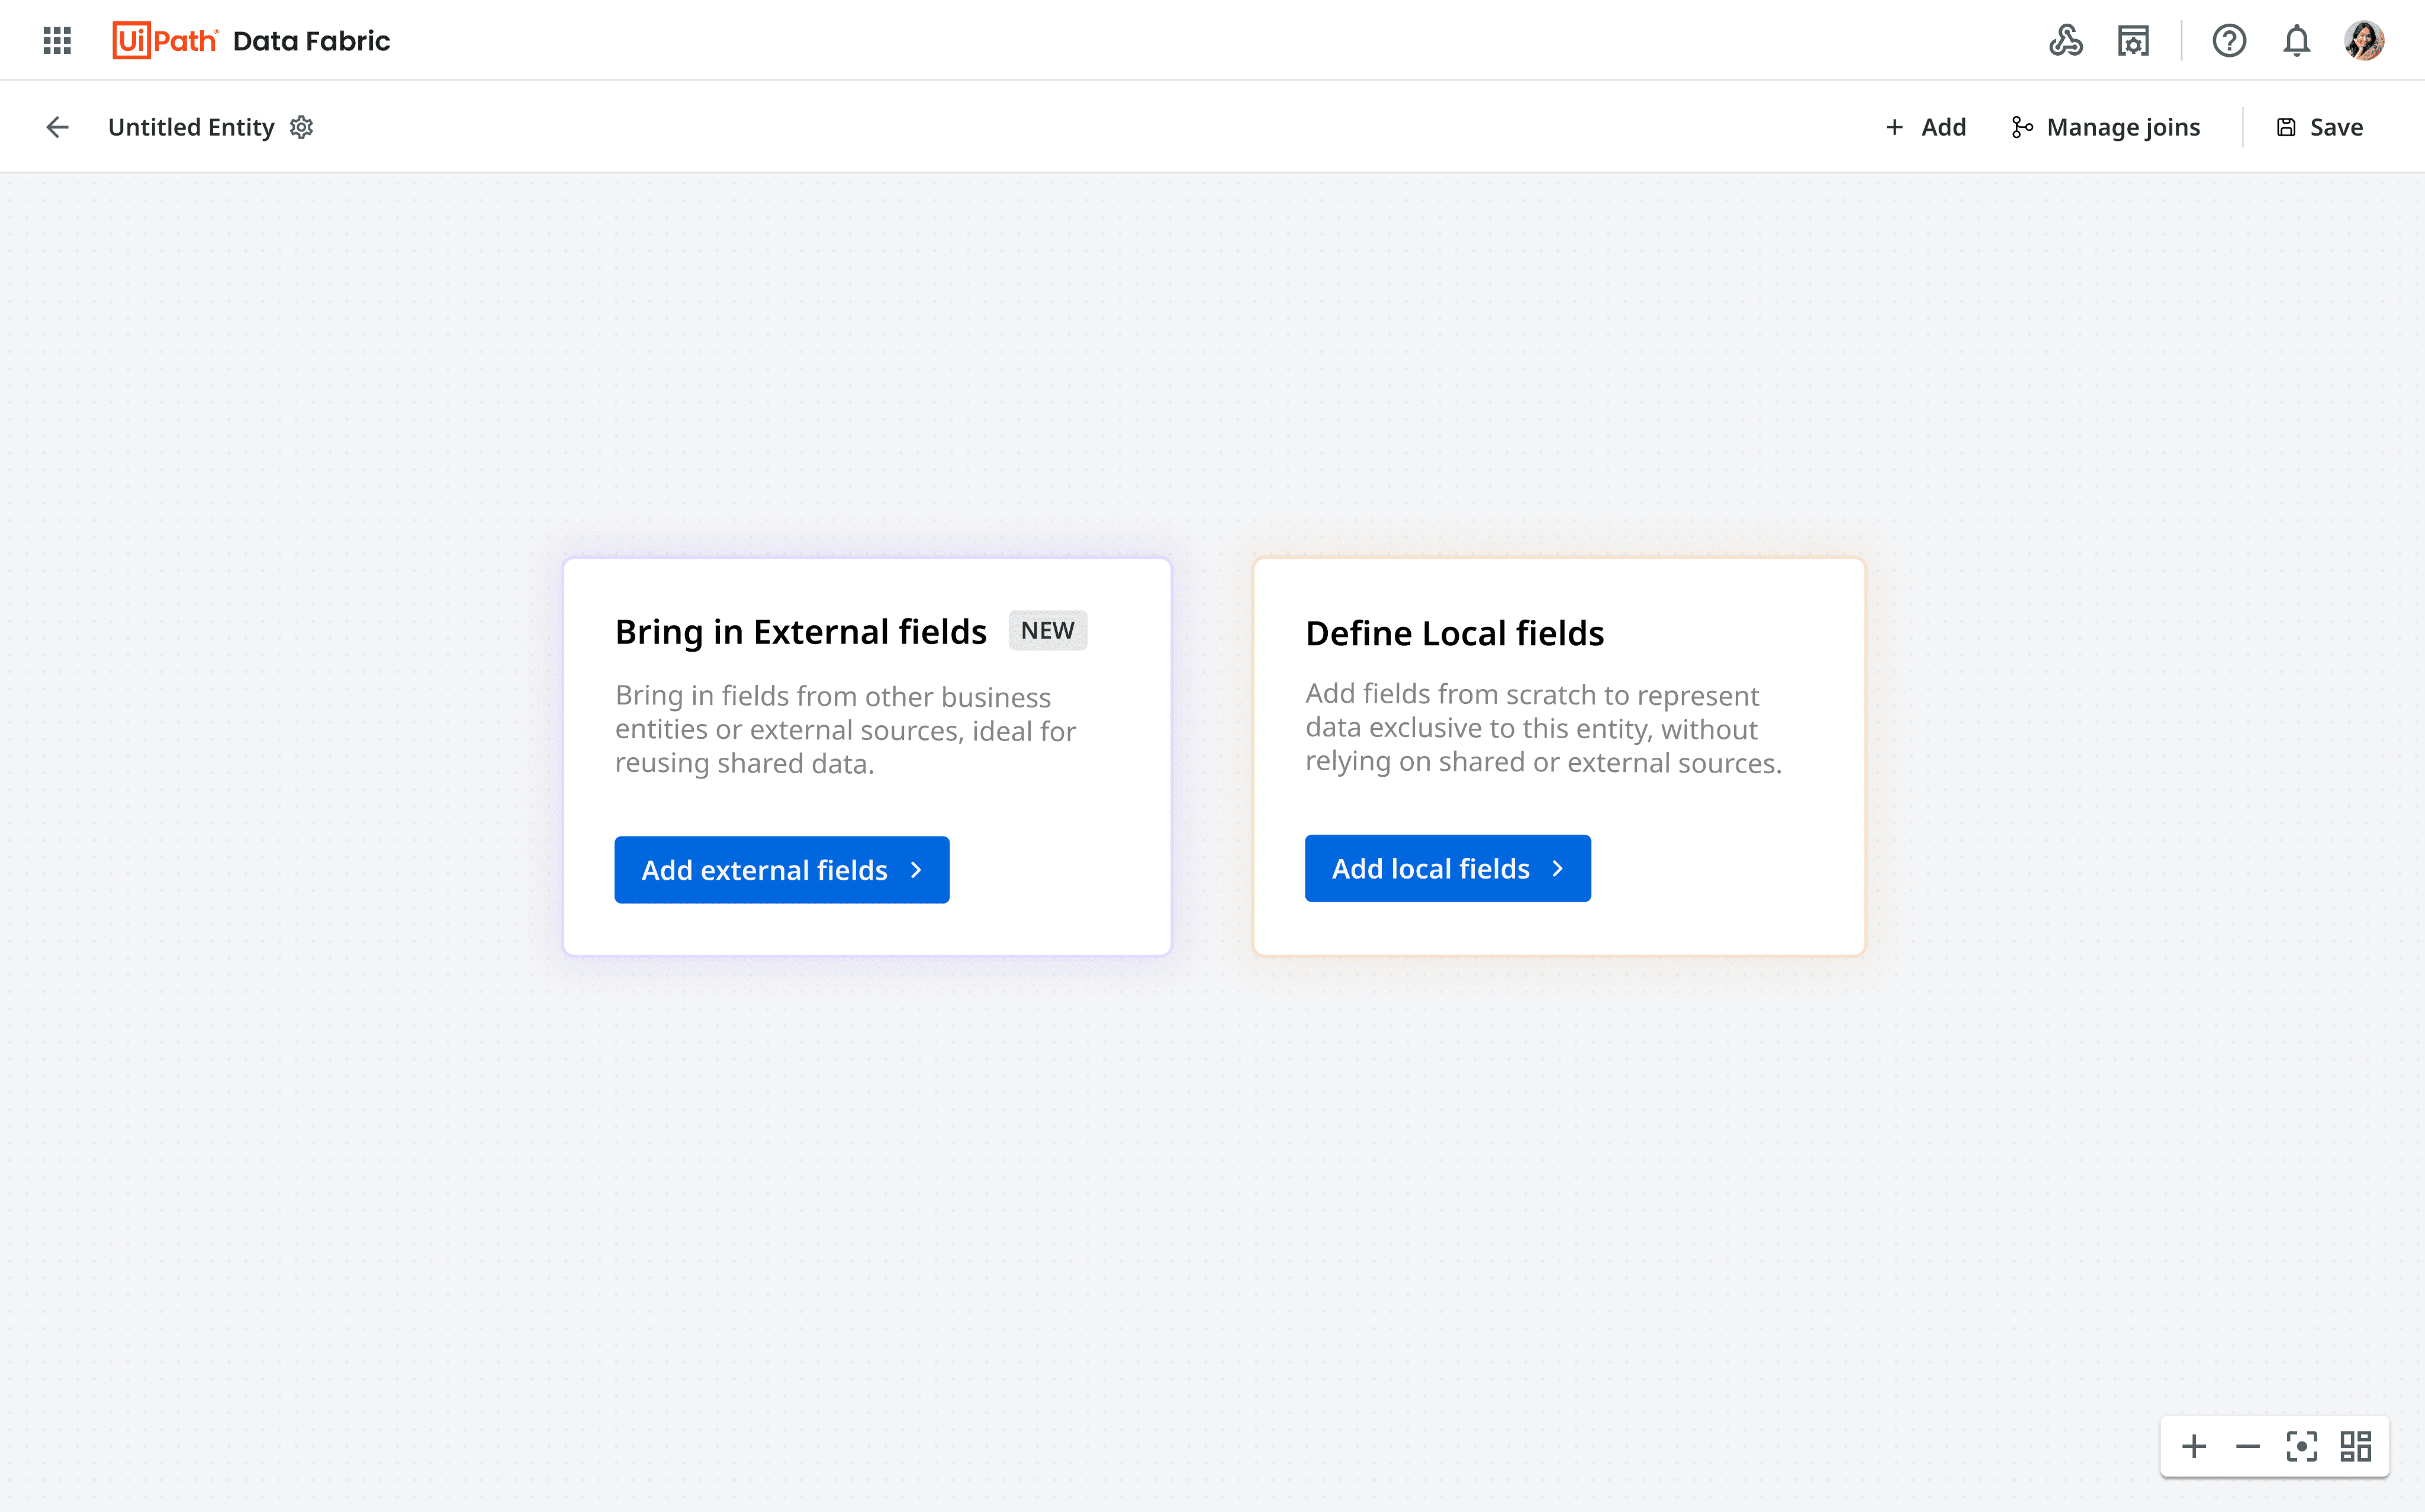
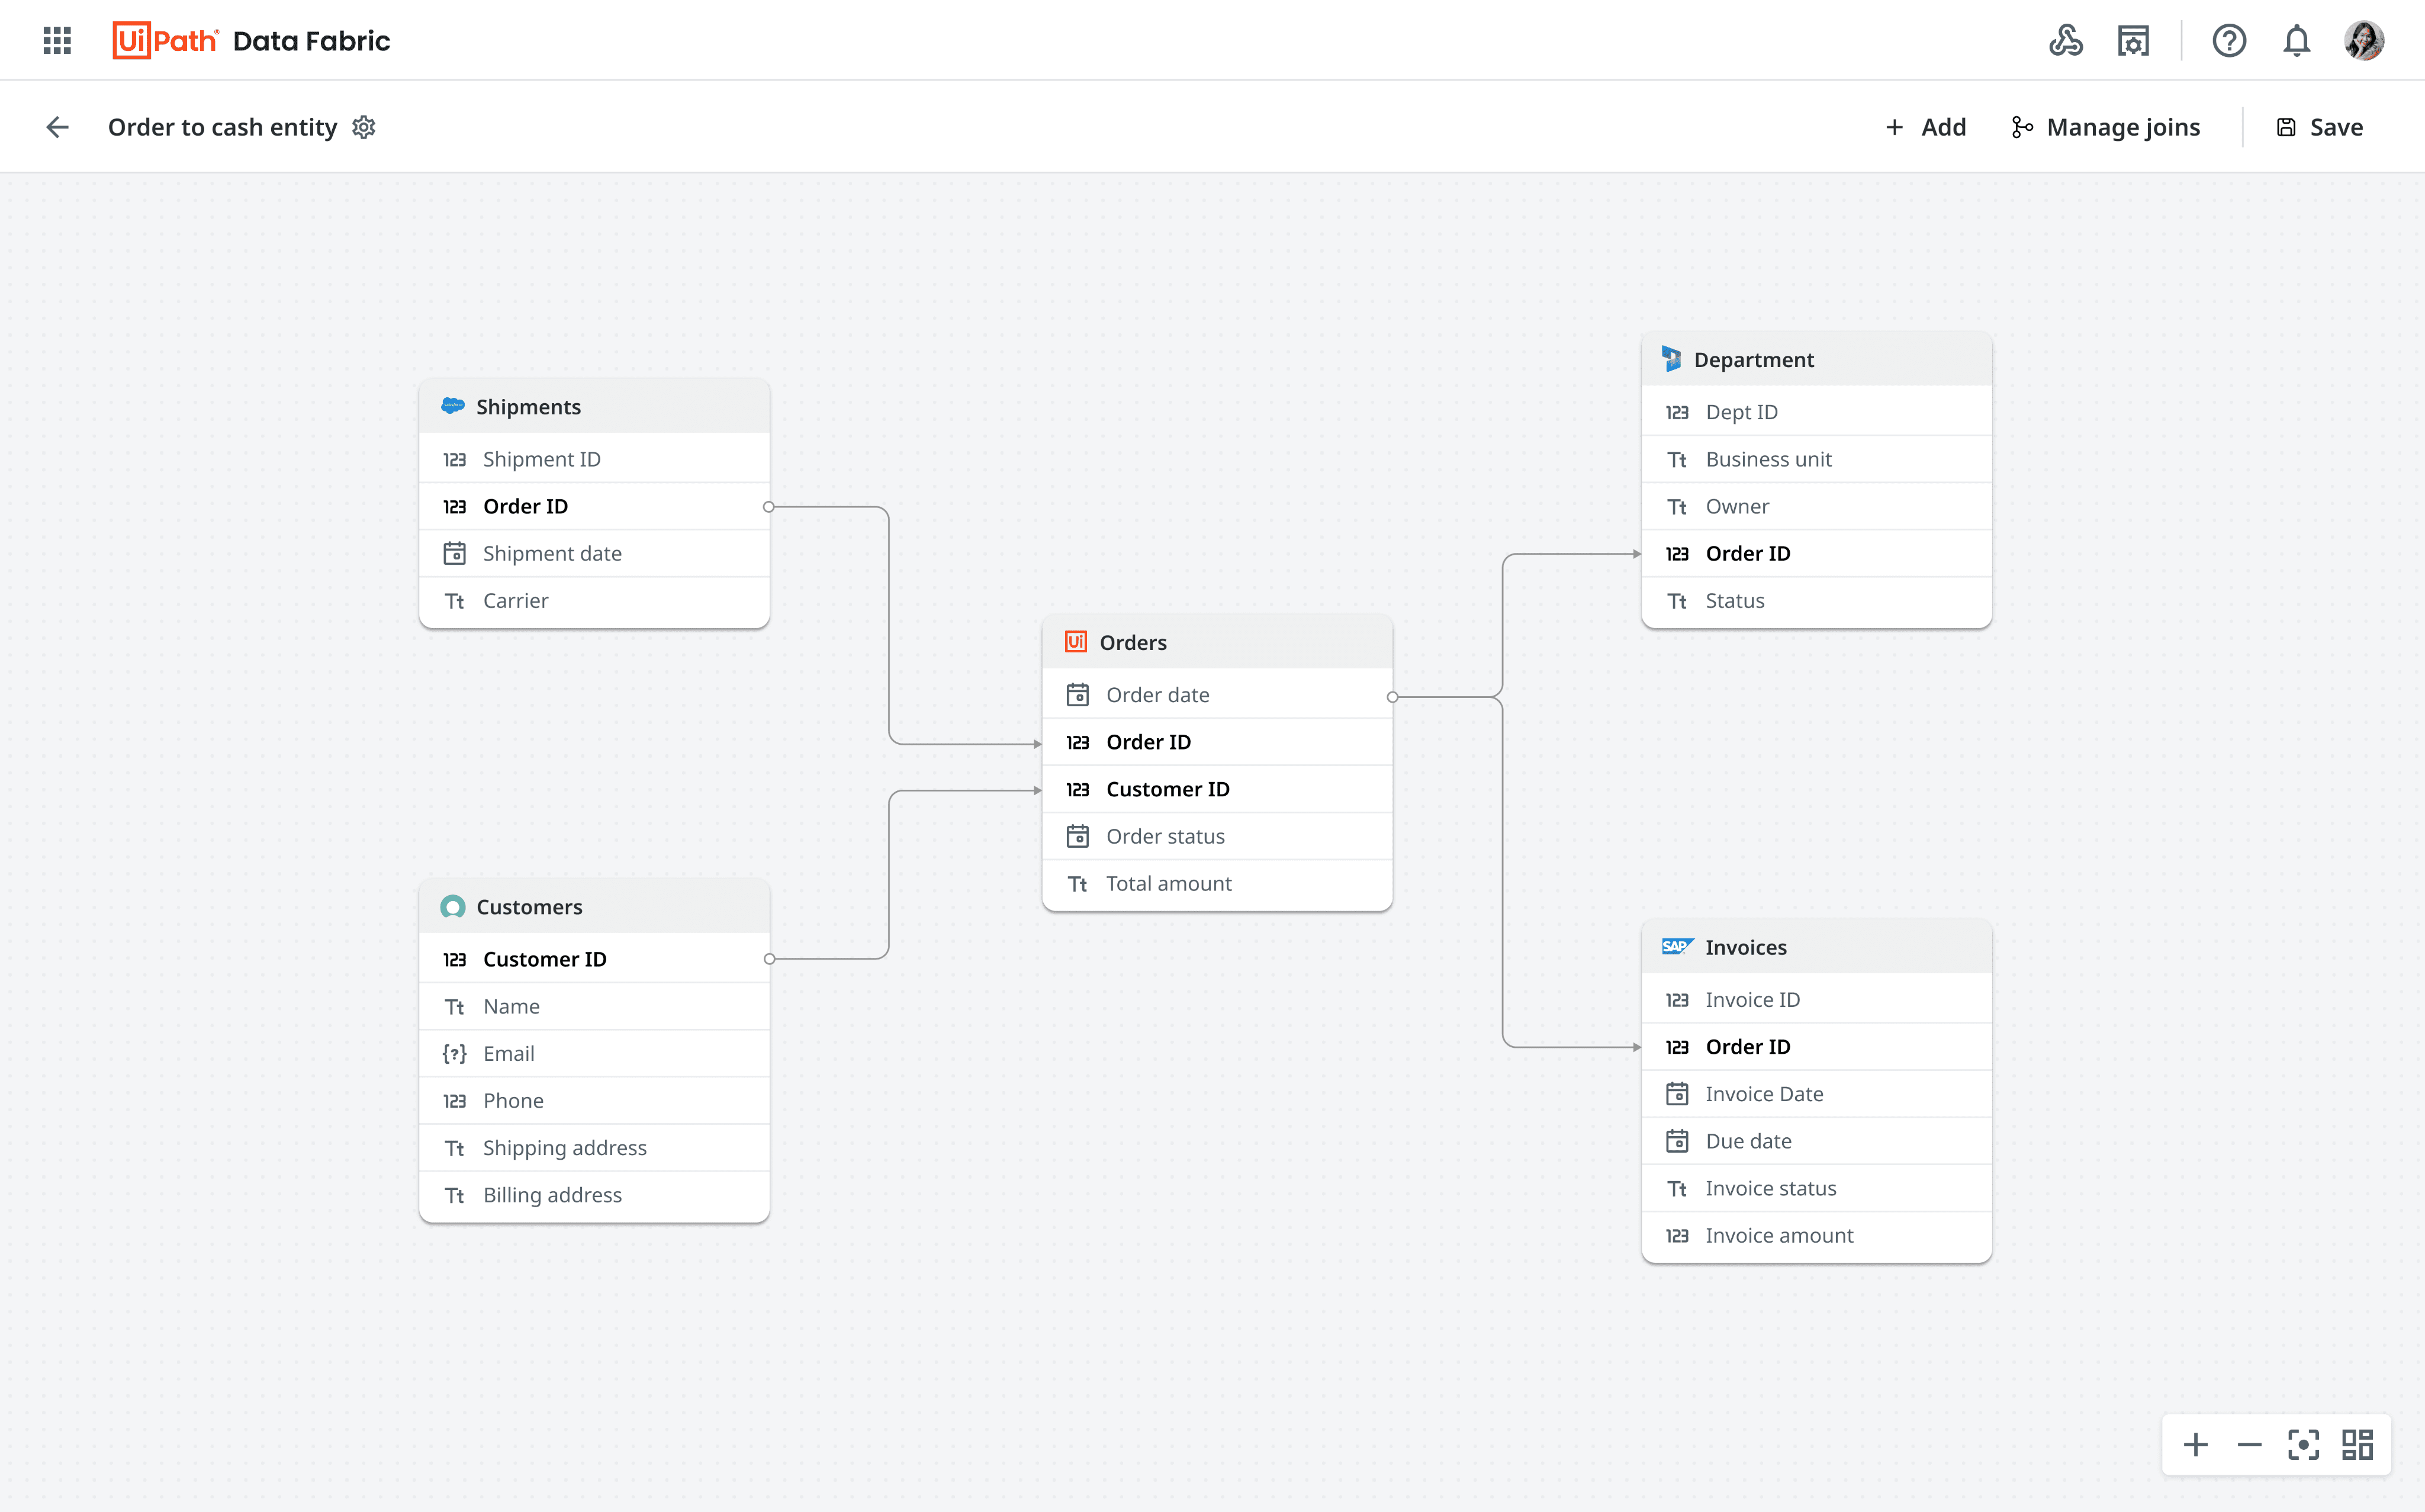
Users can add local fields in this section & configure field properties
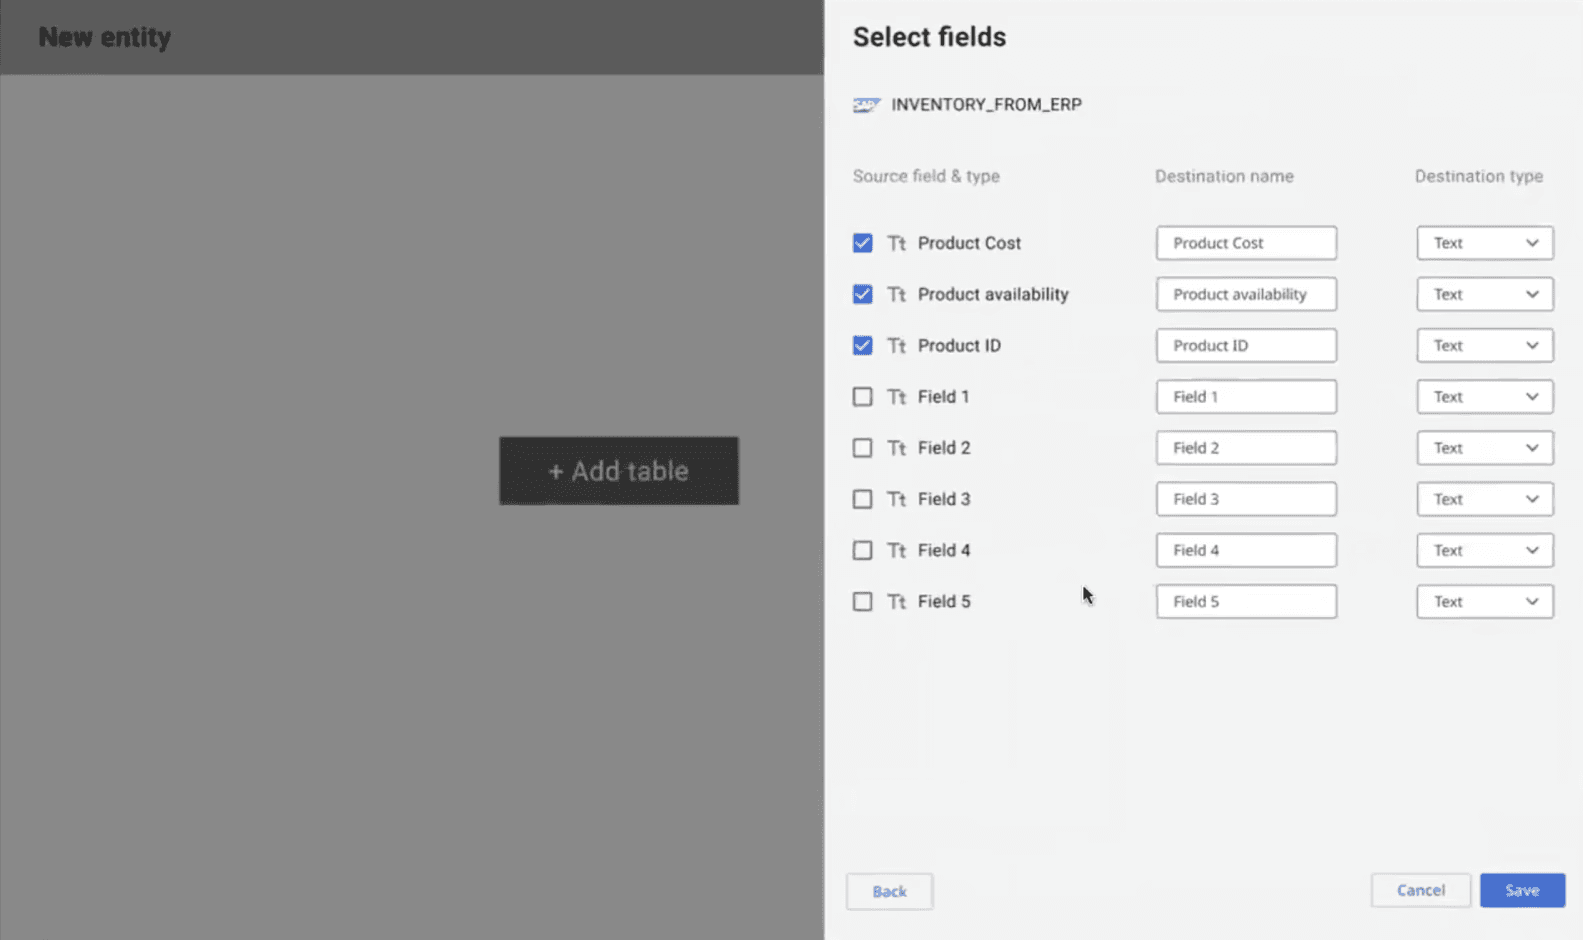
Revamped 'create entity' experience
Users can add external fields in this section by adding the external object and corresponding fields
Basic entity details
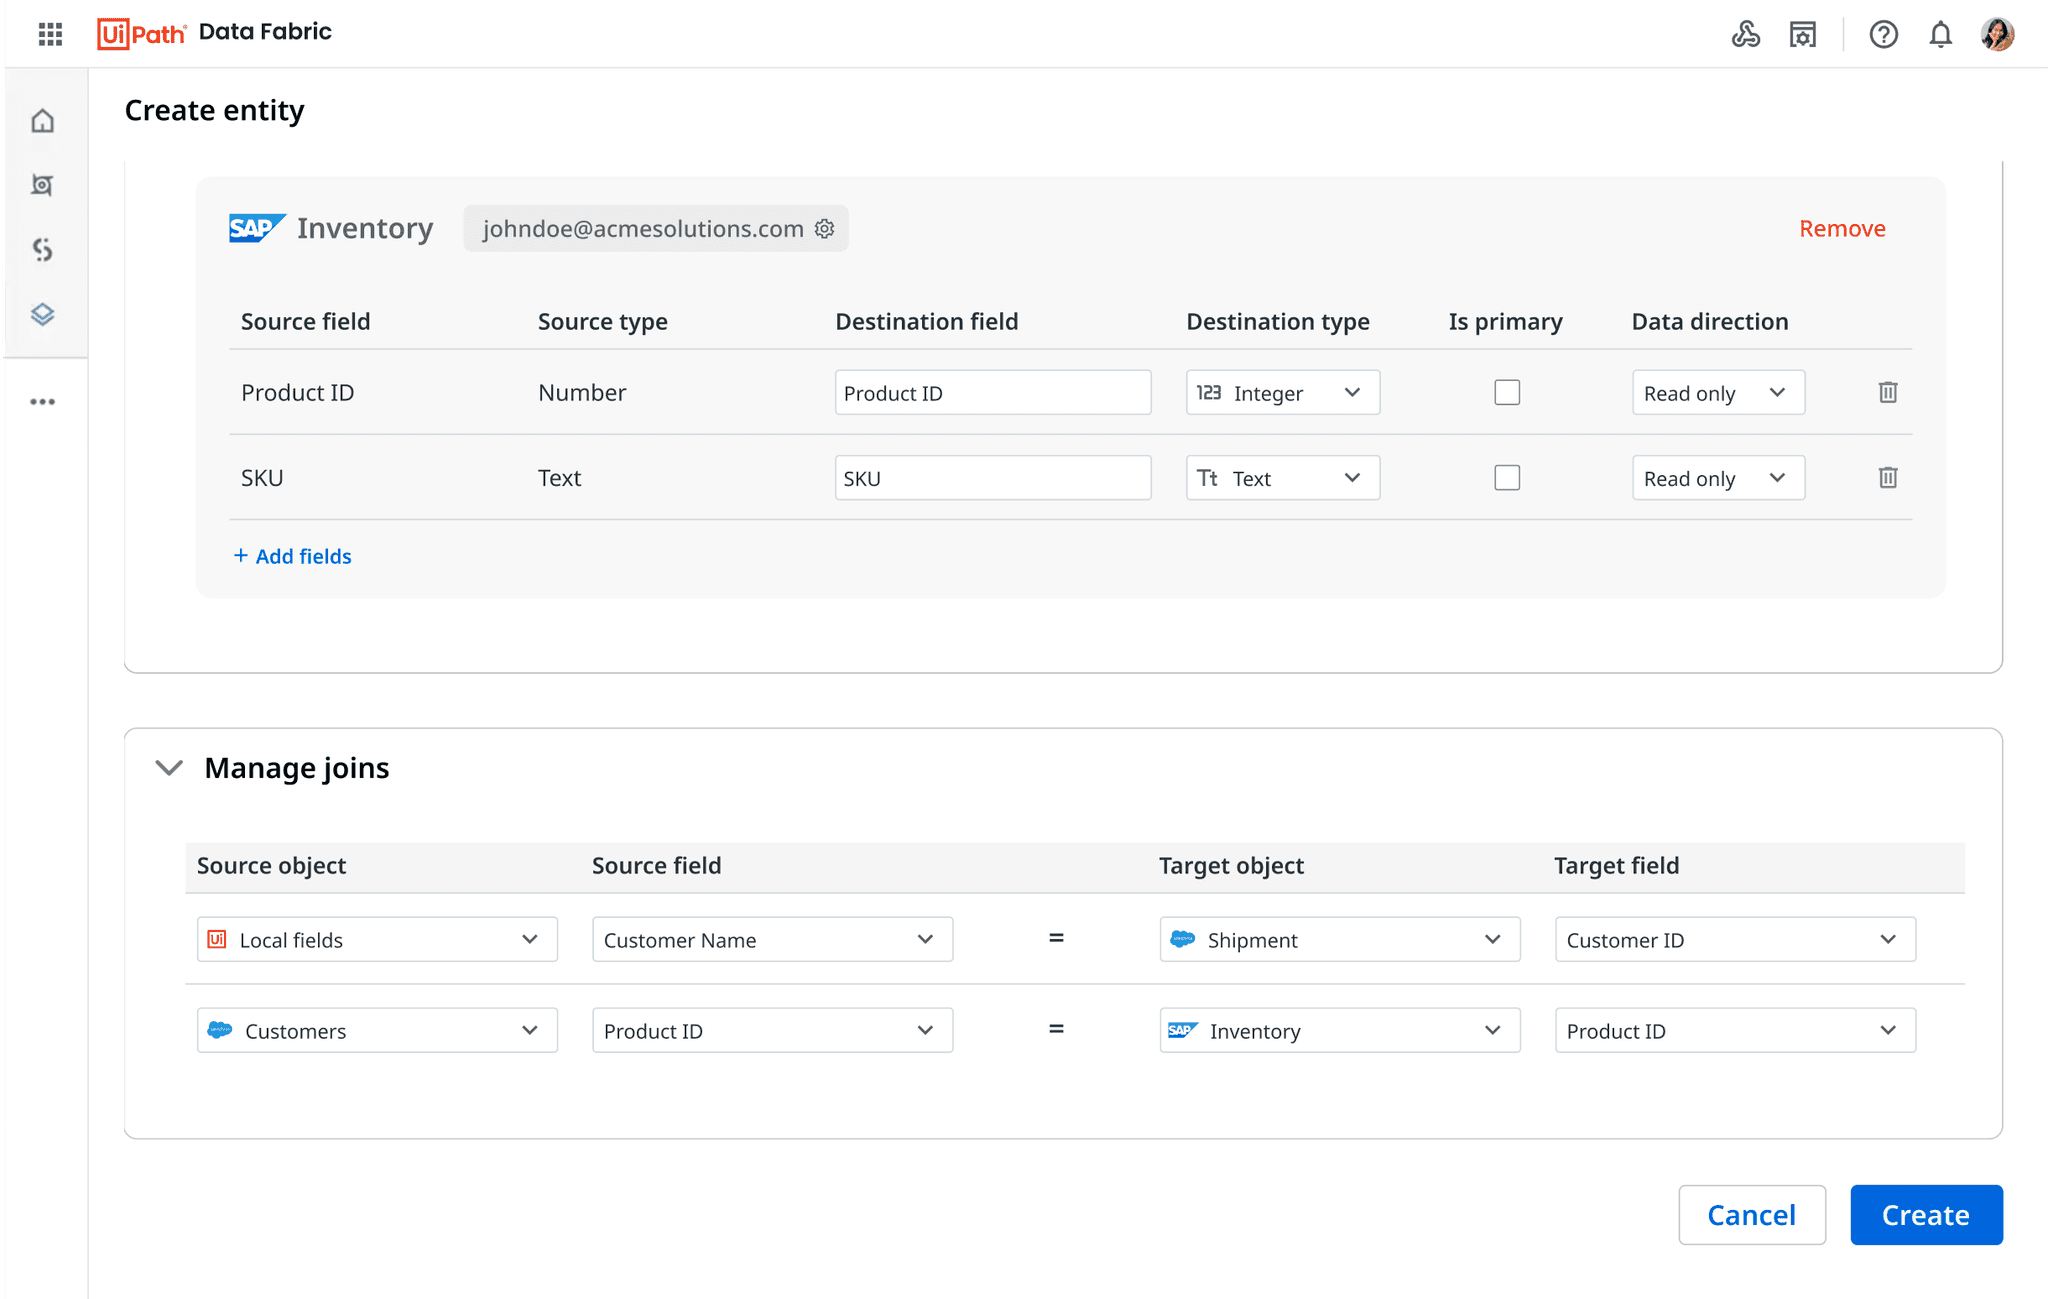
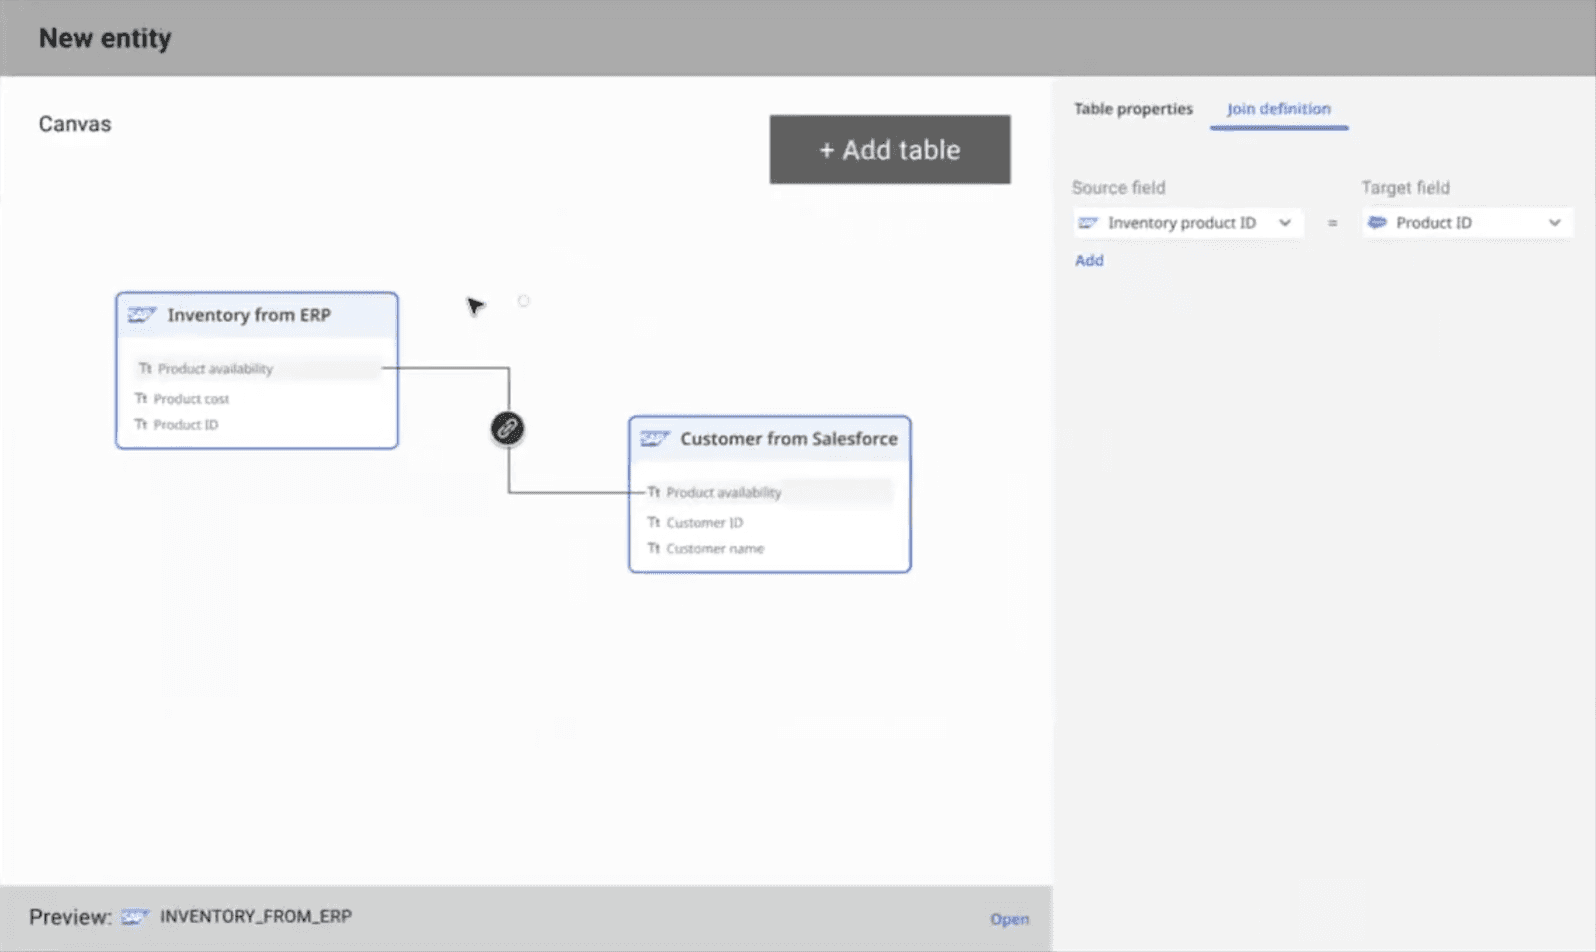
A separate section for creating joins - this helps in combining the fields on the basis of a common field, hence forming a unified table
✅
What worked out
Was quickly able to revamp Data Service to Data Fabric in 60 days - which now had the ability to pull in data from external sources
Utilised existing components and libraries, aimed to reduce engineering workload
17 customers signed up for private preview post design demo
No drastic UI change during entity creation and post creation - less learning curve for existing users
❌
What did not work out
Scalability issues - Handling complex entities consisting of hundreds of external fields would difficult with this UI
Inability to visualize the how objects are stitched together through joins
Lack of visualization might result in a lot of errors at the join level
UI looks cluttered specially when dealing with large no. of local & external fields
Deep diving into feedback
UiPath Devcon - Customer feedback
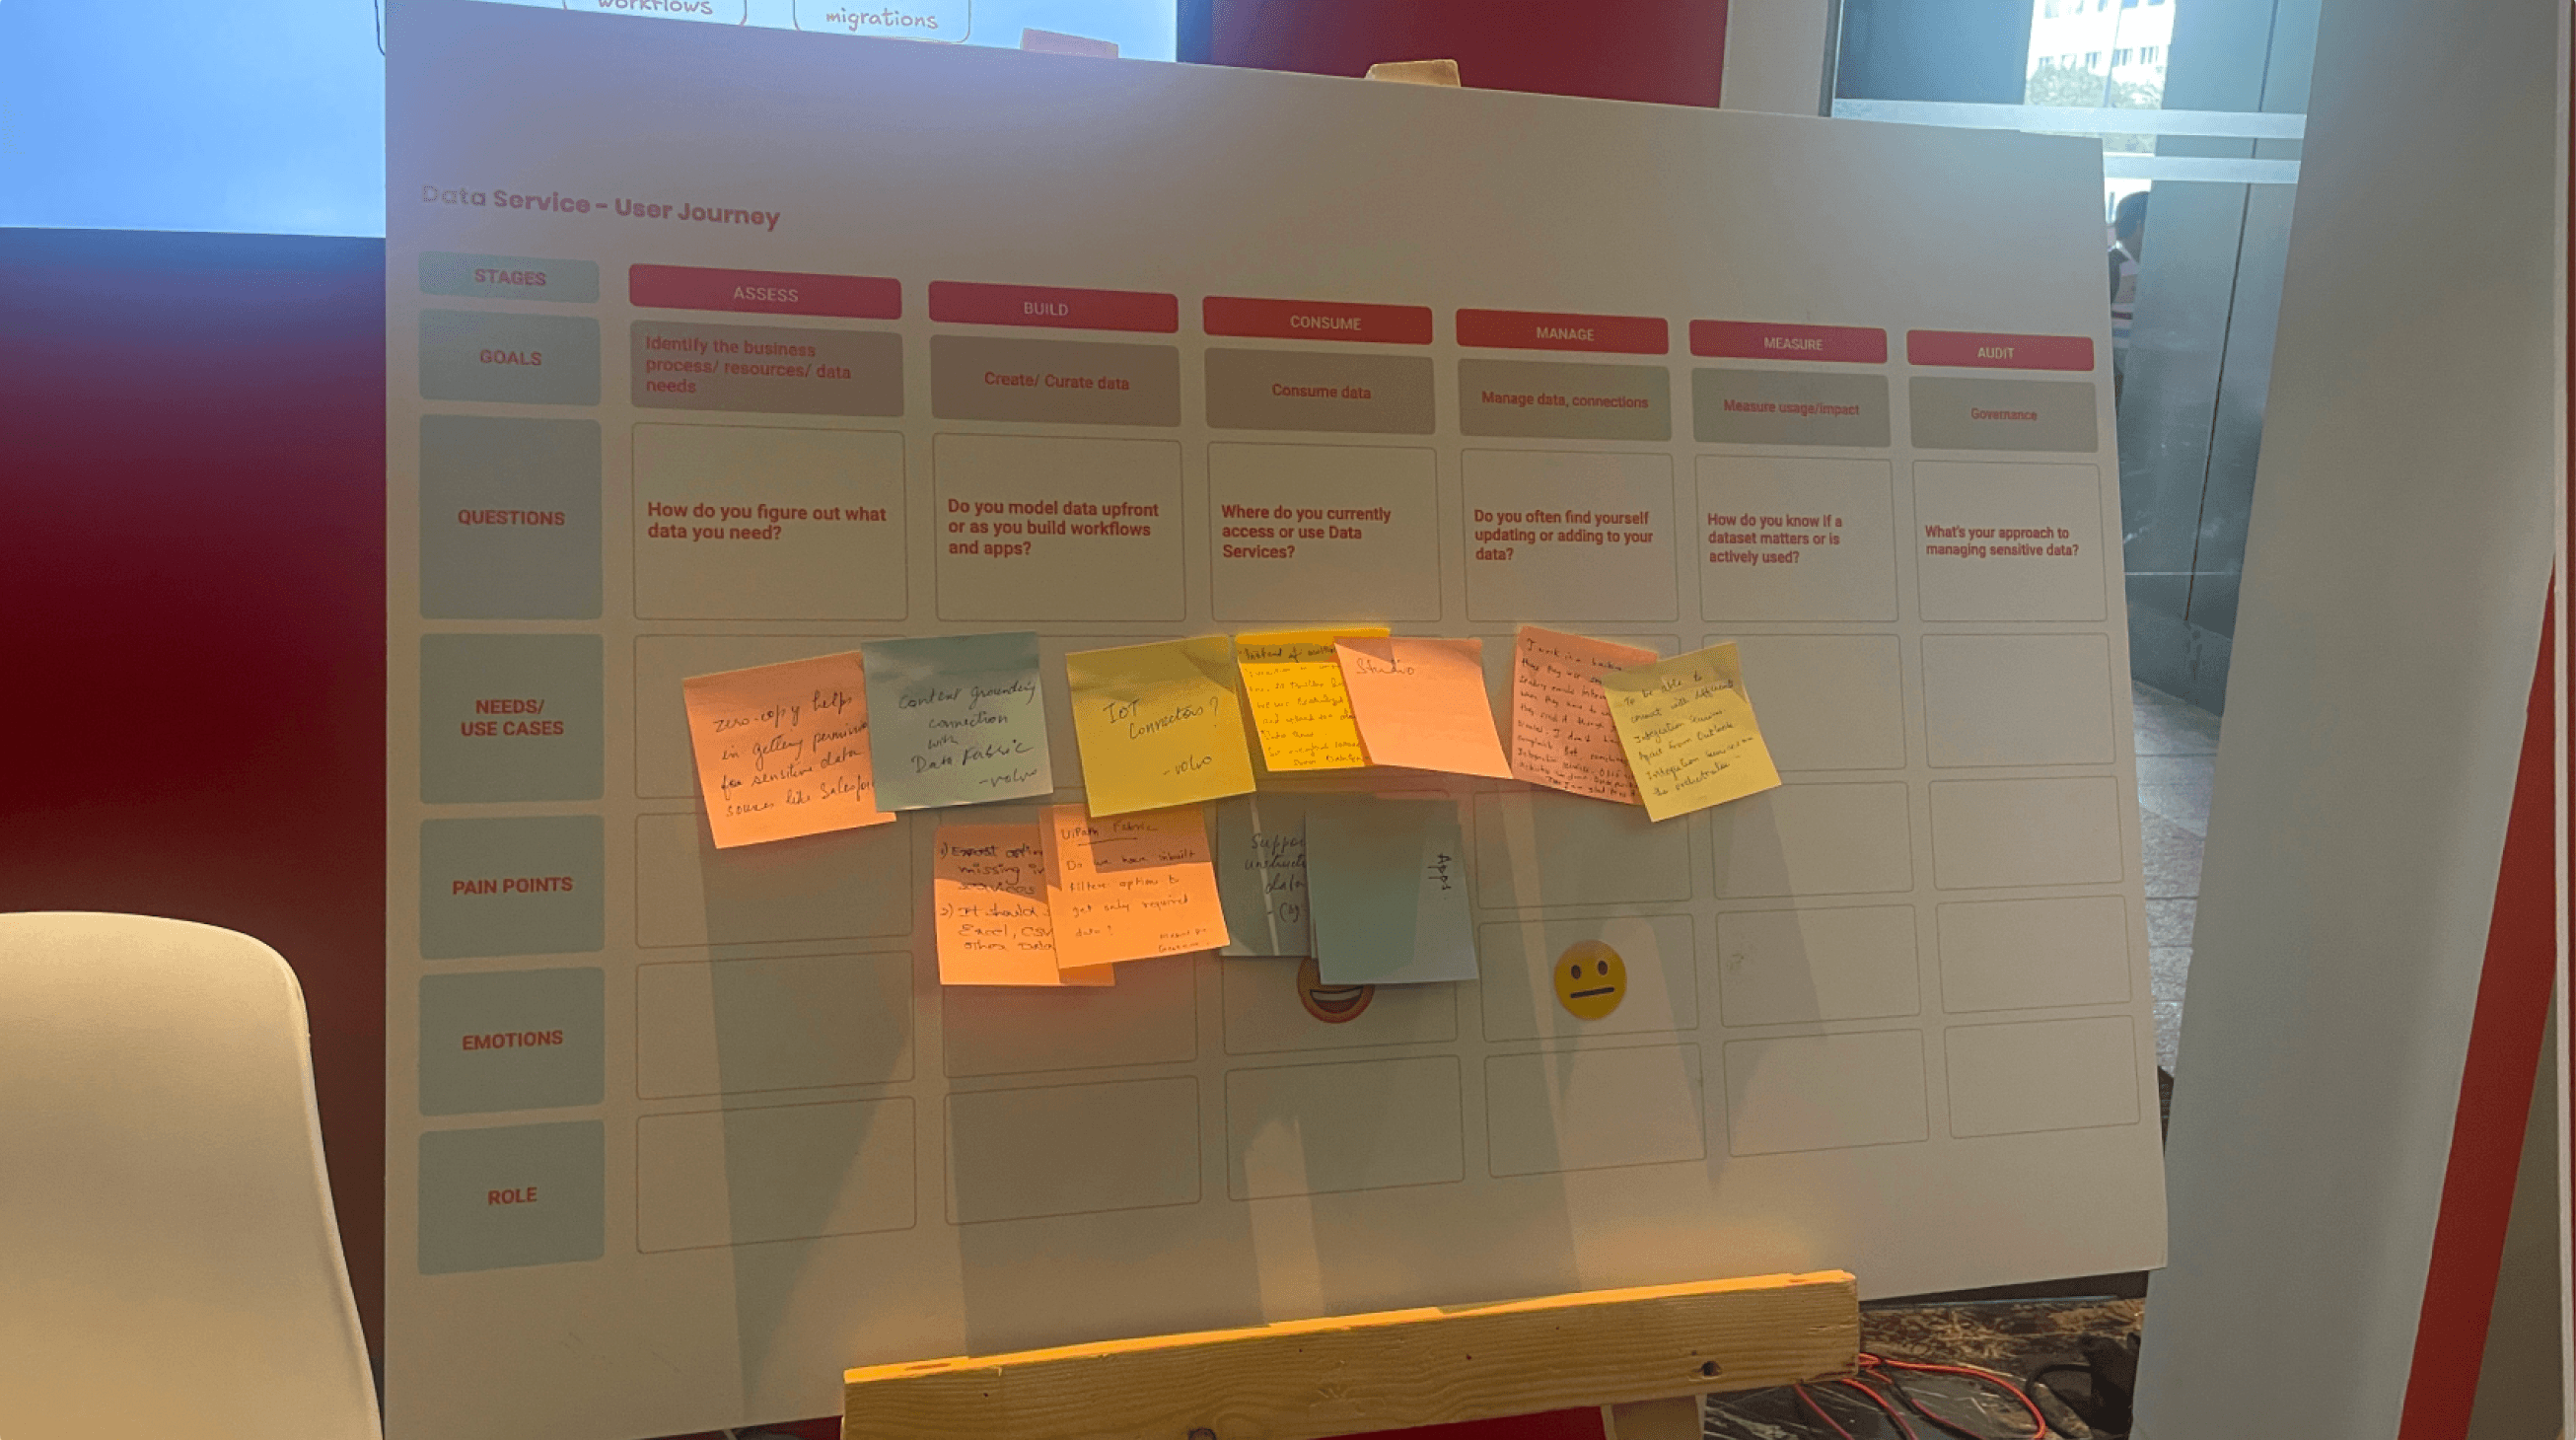
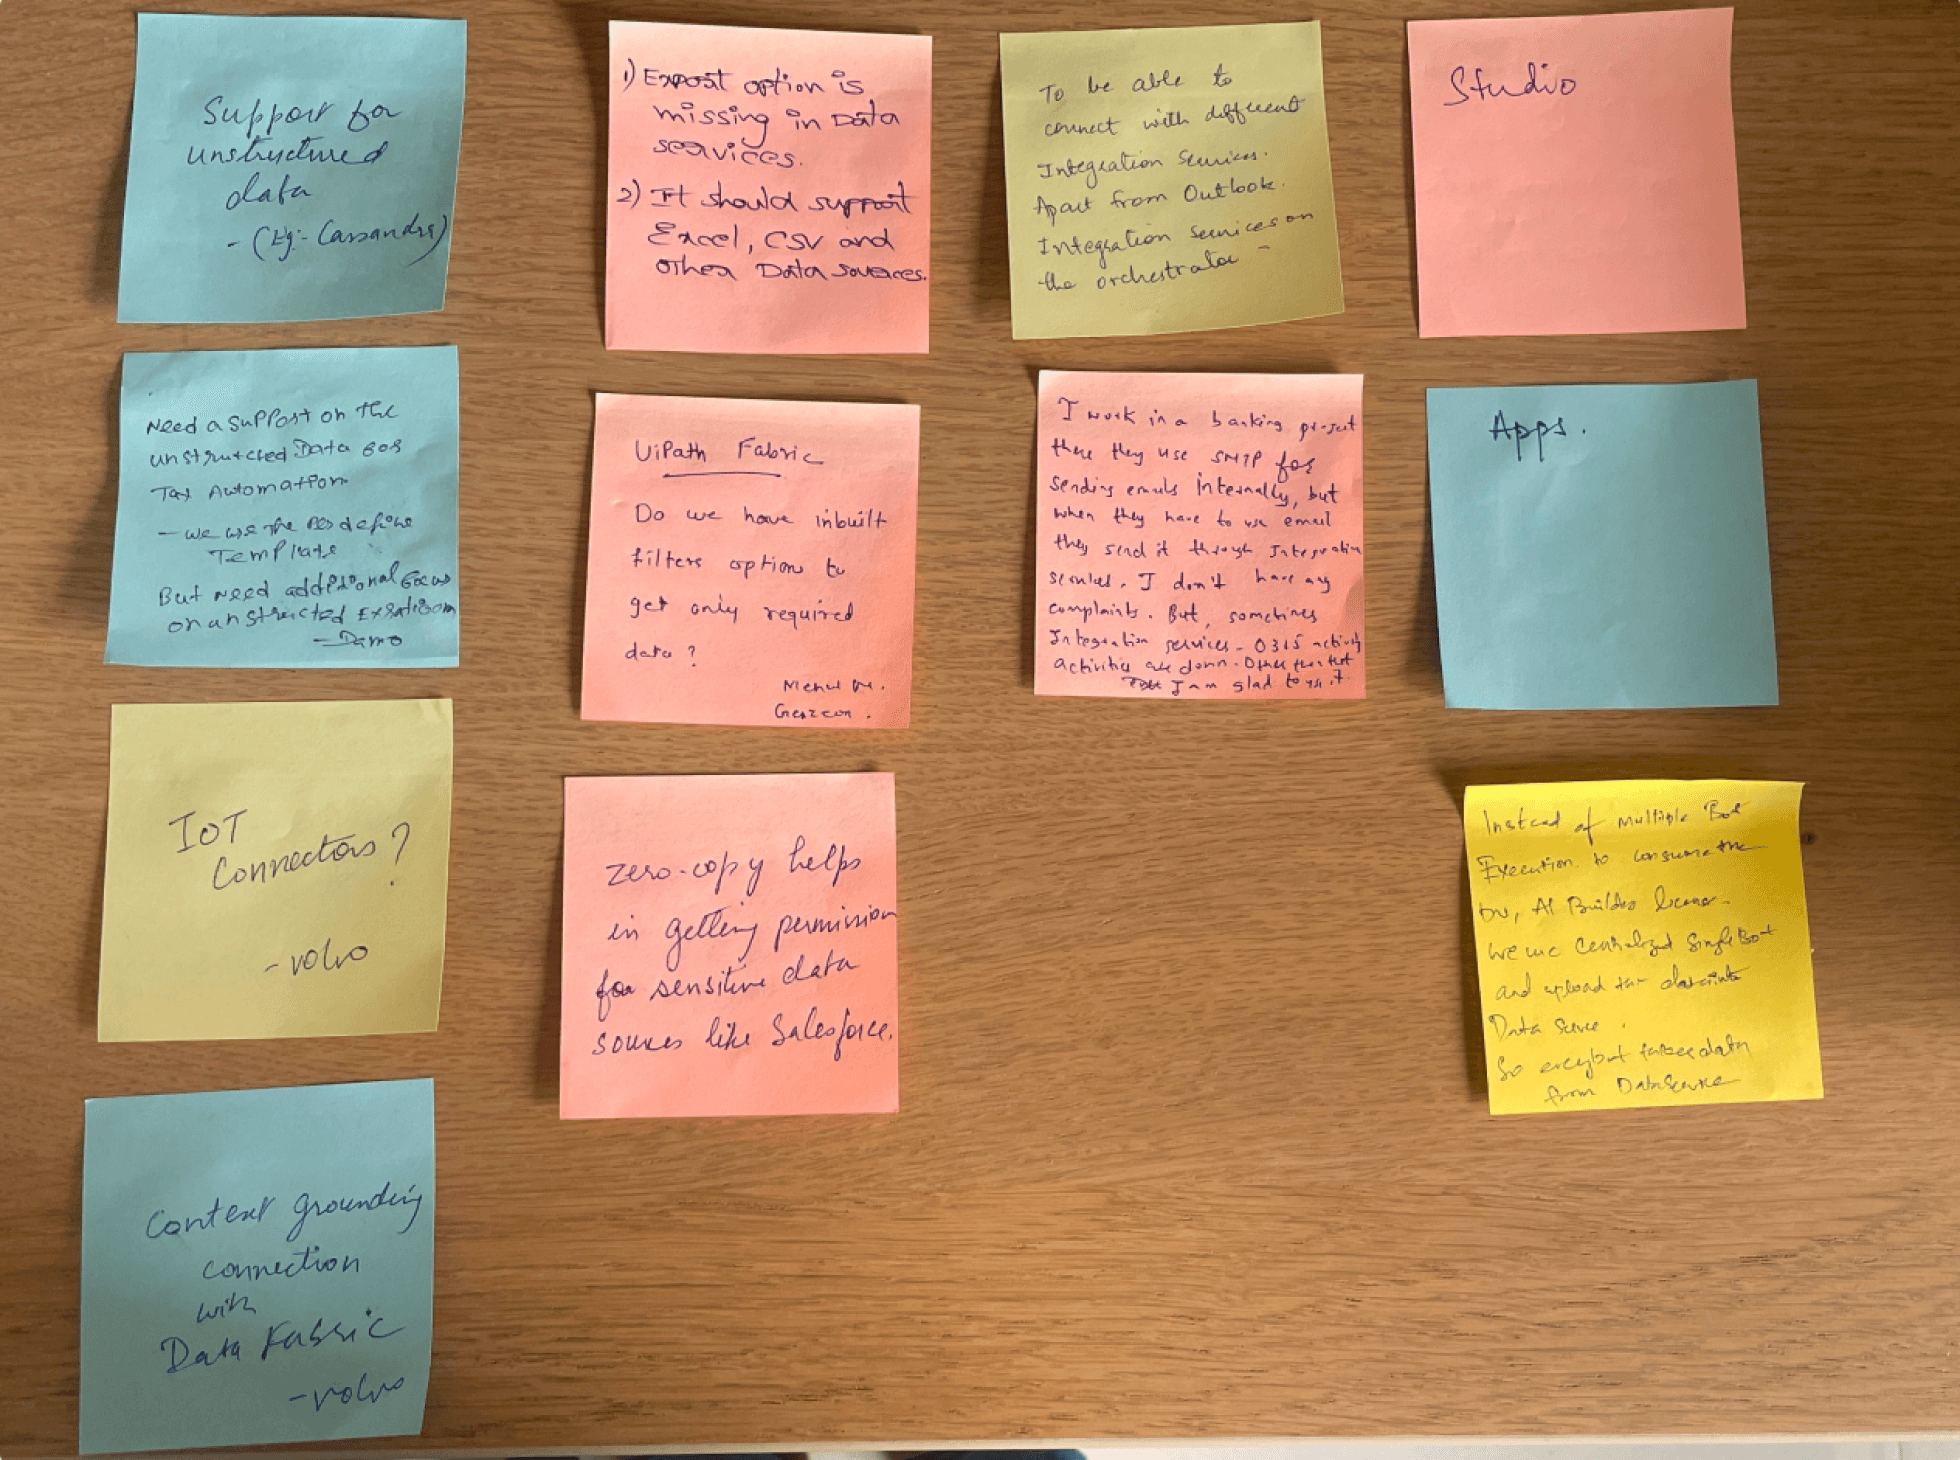
Making sense out of chaos
LIKES
NEEDS
INTEGRATIONS
CONSUMPTION

The Canvas Approach
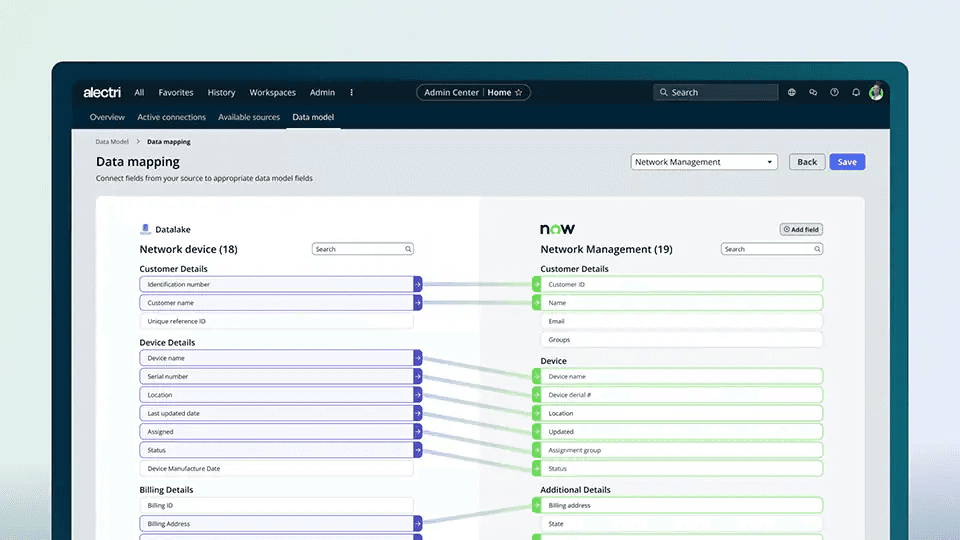
Competitor analysis
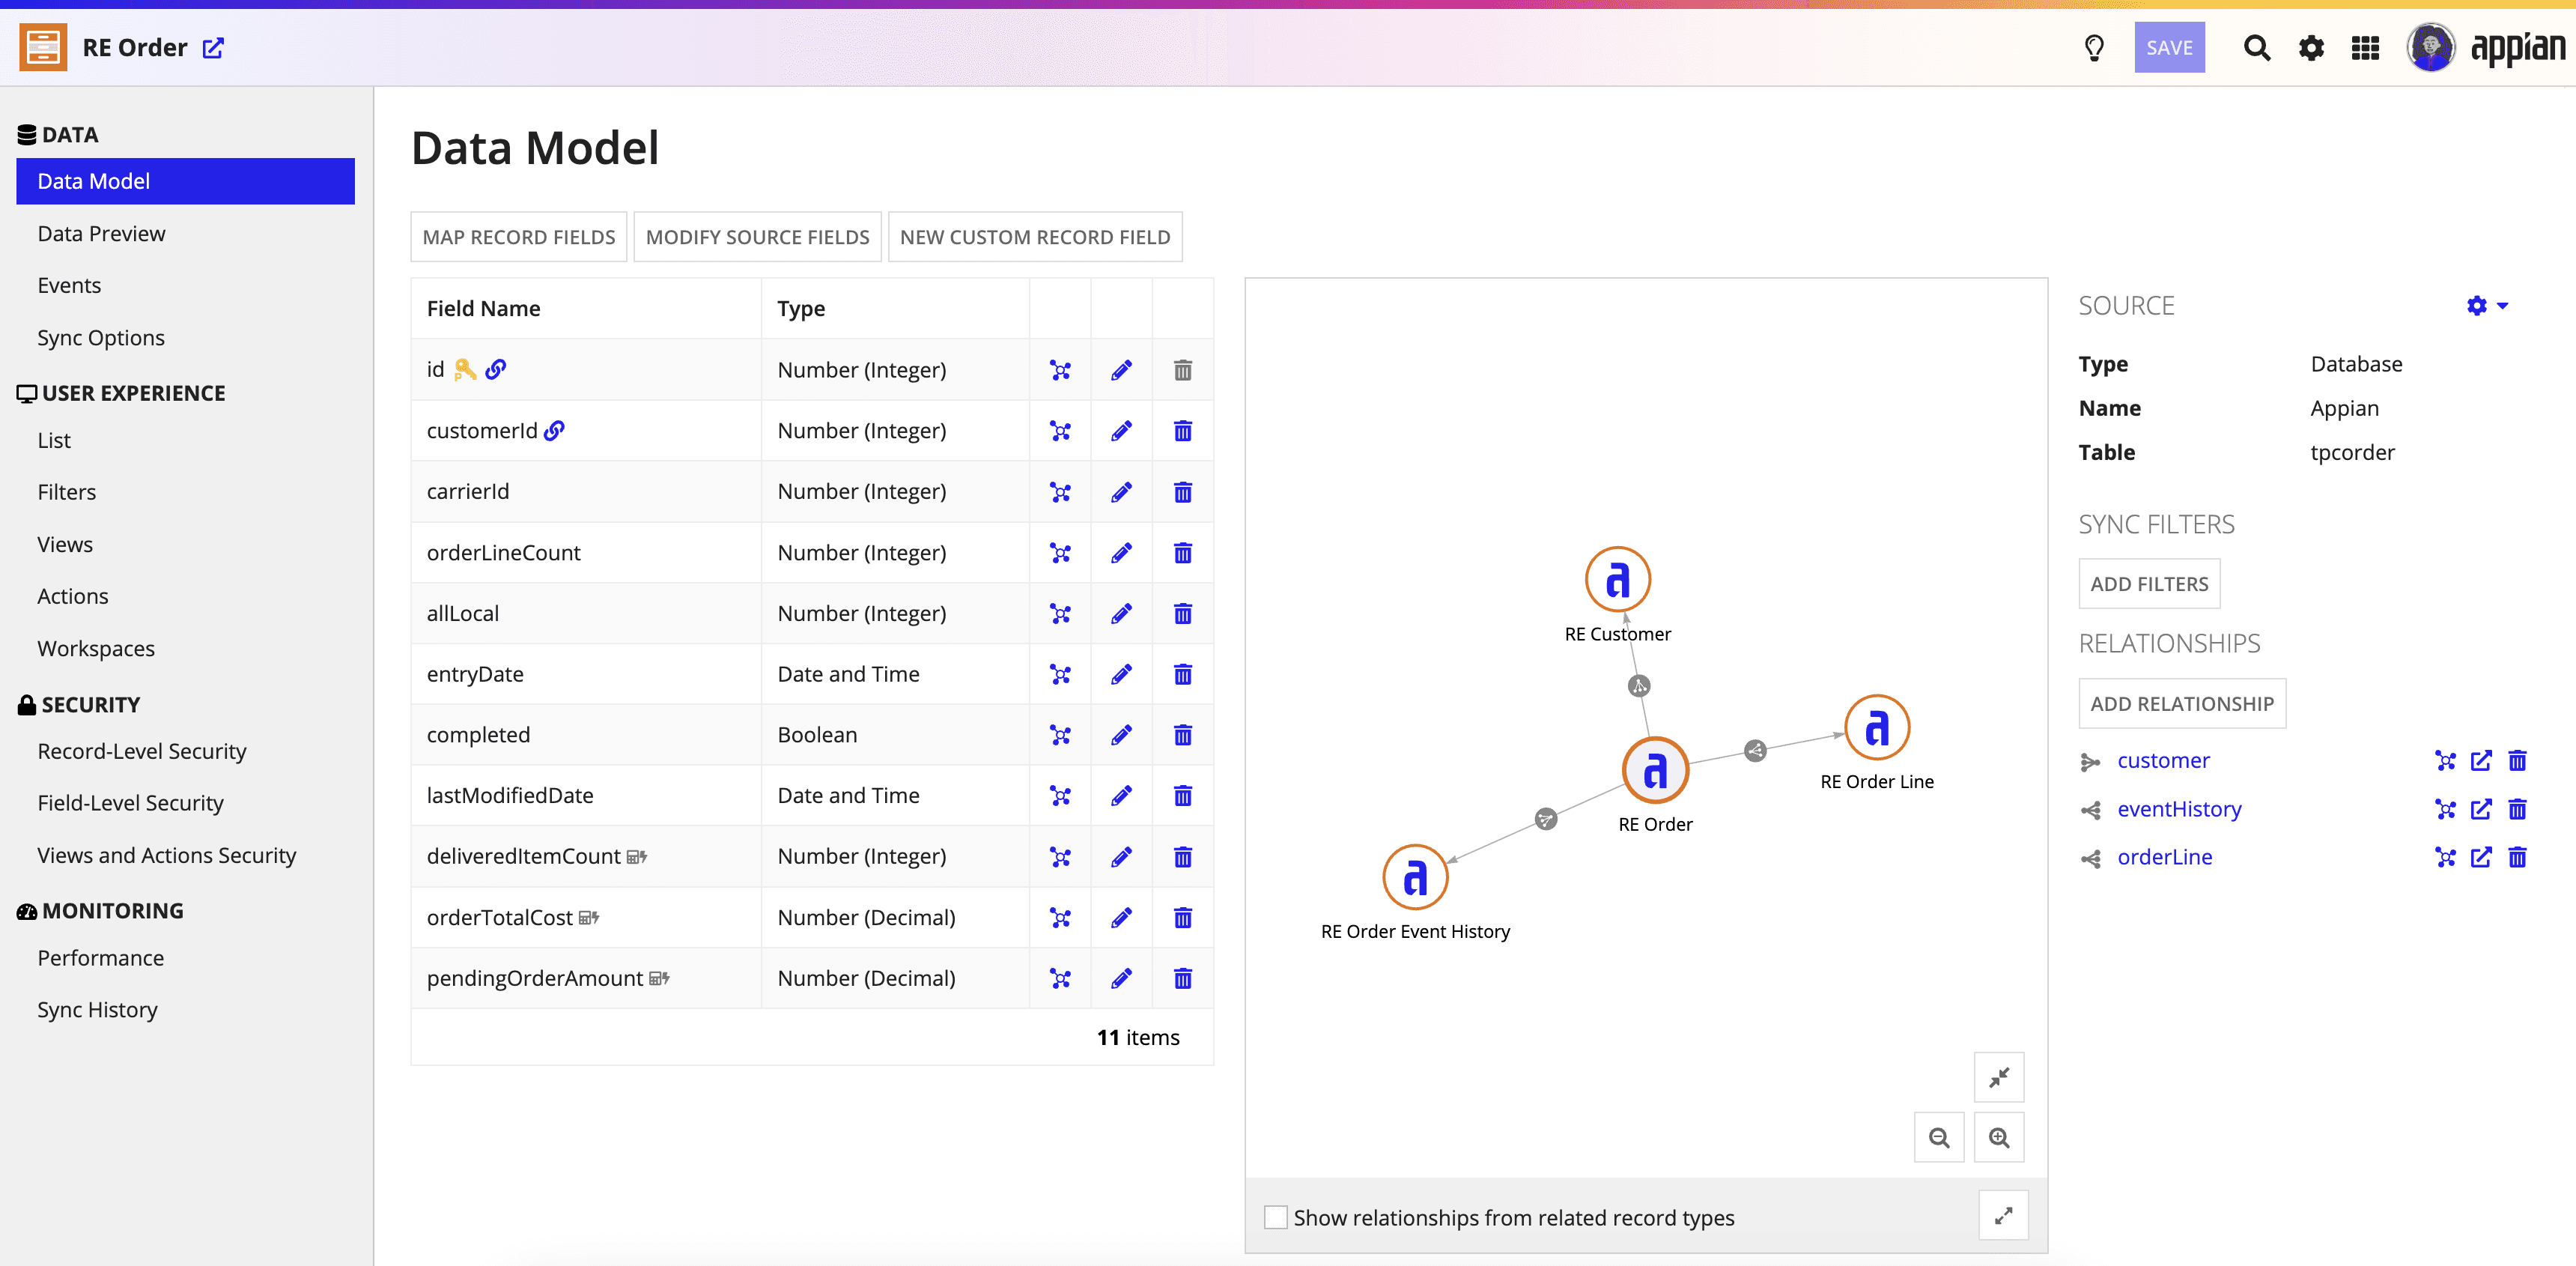
Exploring layouts
Action bar
Properties
Canvas
Data view
✅
PROS
Autopilot can exist as right panel
Less no. of panels. Better focus
In most cases data view might be collapsed resulting in better focus
on canvas and left panel
❌
CONS
Mental model of users is to expect properties on the right and not left
Scanning of the page from left > centre > left, is not ideal
Slightly inconsistent with rest of our products
Action bar
Explorer?
Canvas
Properties
+
Data view
✅
PROS
Less no. of panels. Better focus
Autopilot can exist as right panel
❌
CONS
Inability to view data and properties simultaneously
Users are more accustomed to right / left panels instead of bottom panels
Action bar
Explorer?
Canvas
Data view
Properties
✅
PROS
Follows a similar pattern as UiPath Studio
Ability to view properties & data simultaneously
❌
CONS
Too many panels, users might lose focus
Issues adjusting all the field properties in the right panel
Autopilot will add a second panel adjacent to the right panel
Option 1
Option 2
Option 3
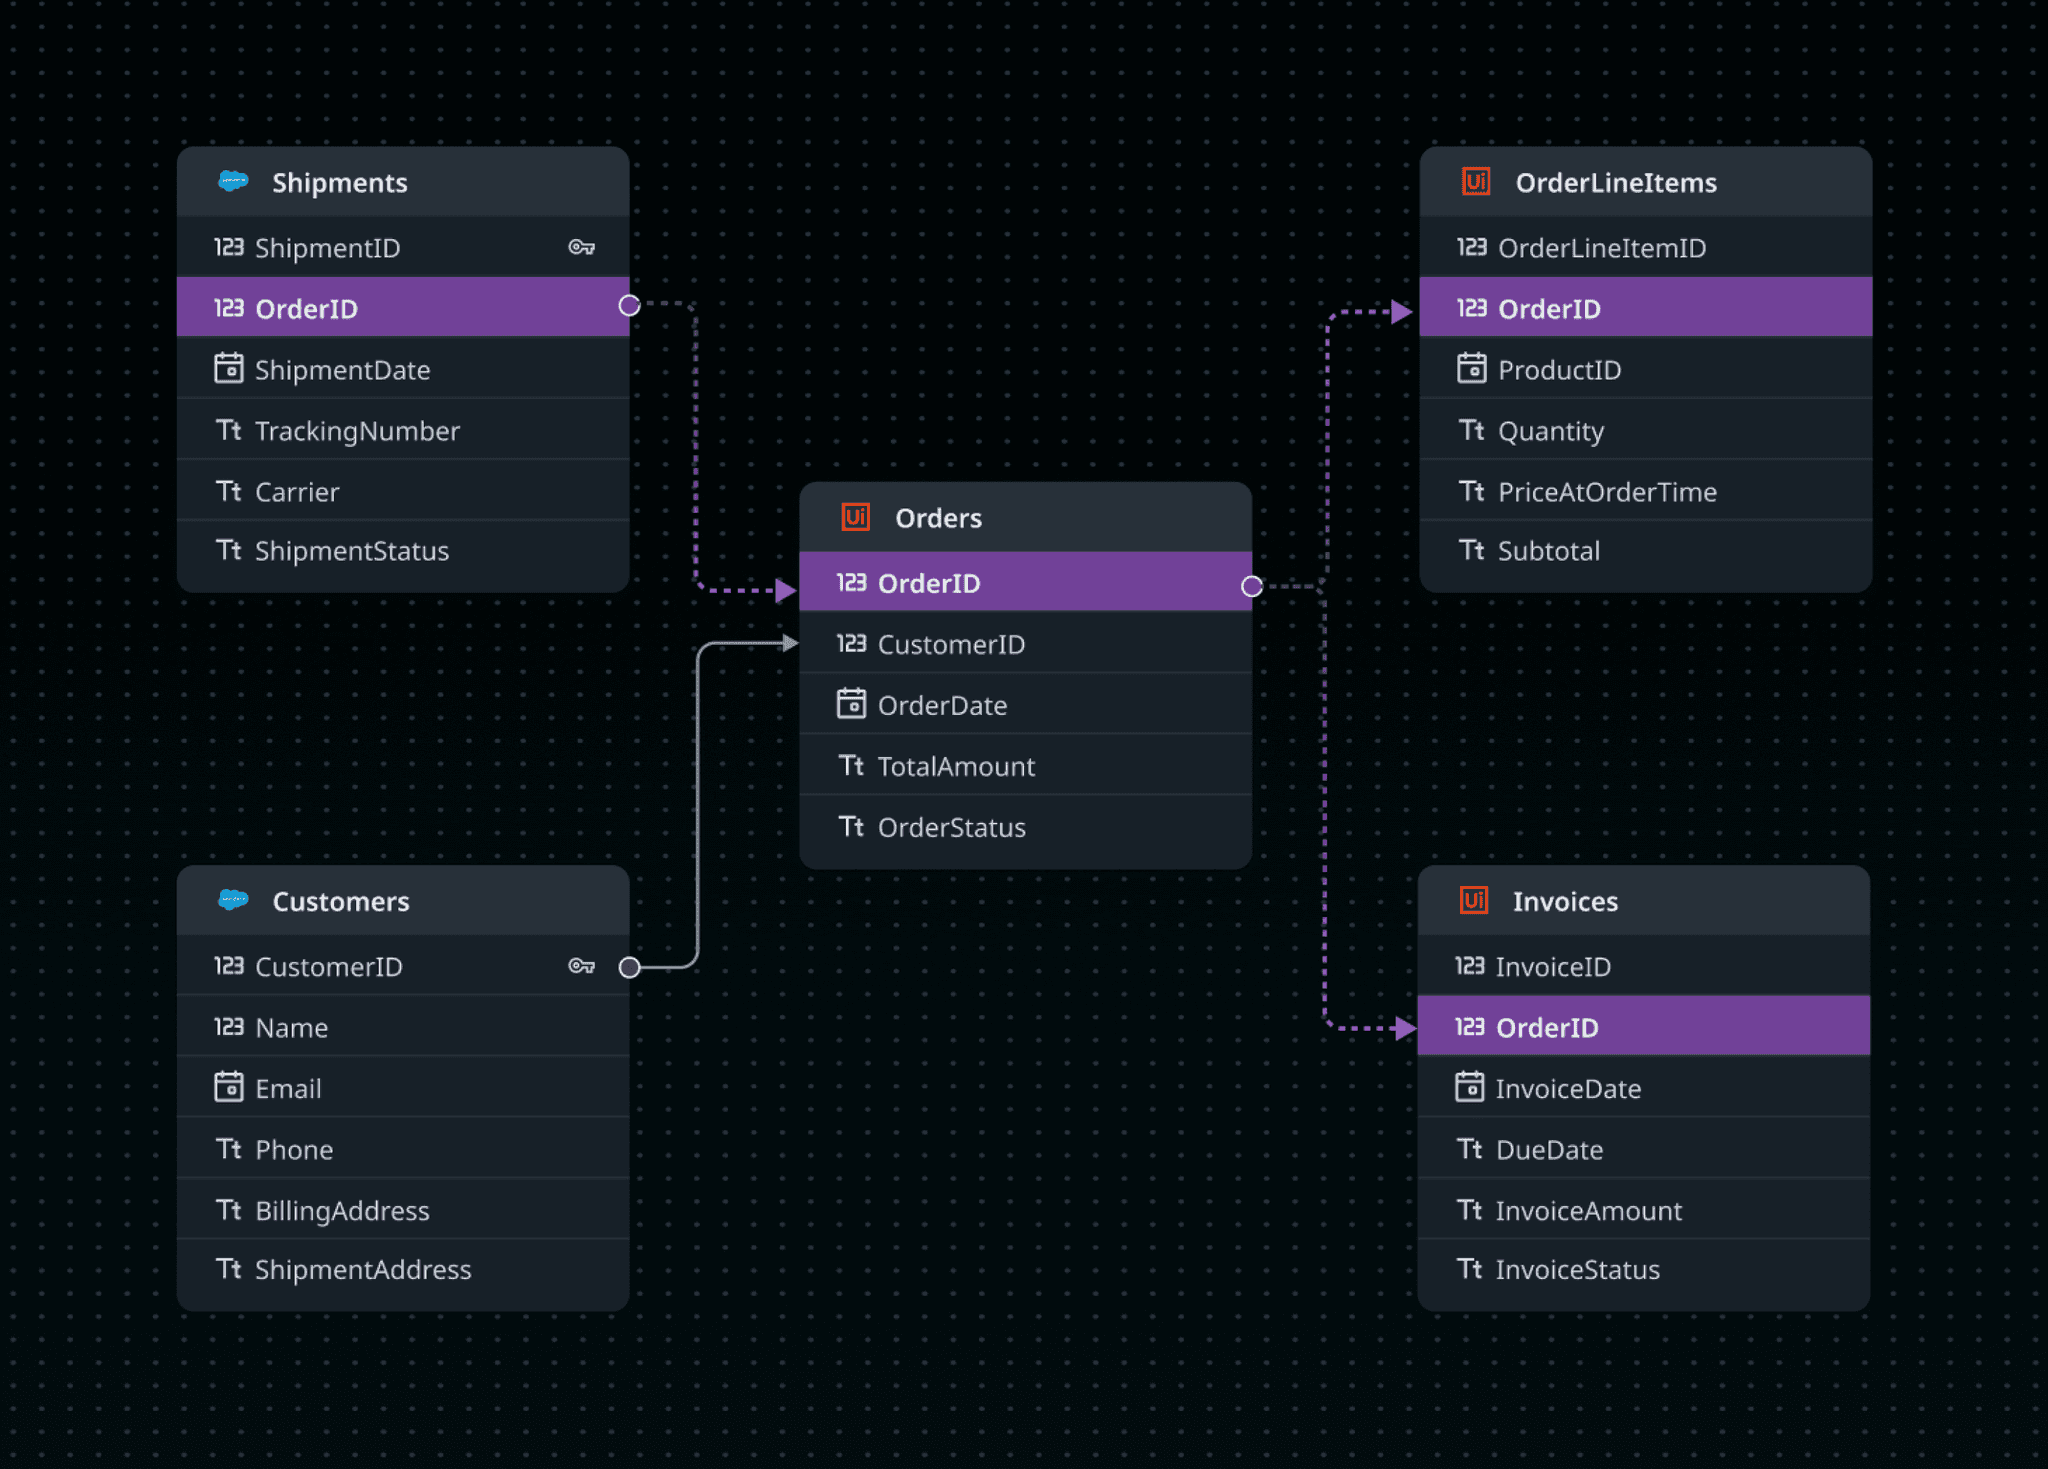
Wireframes

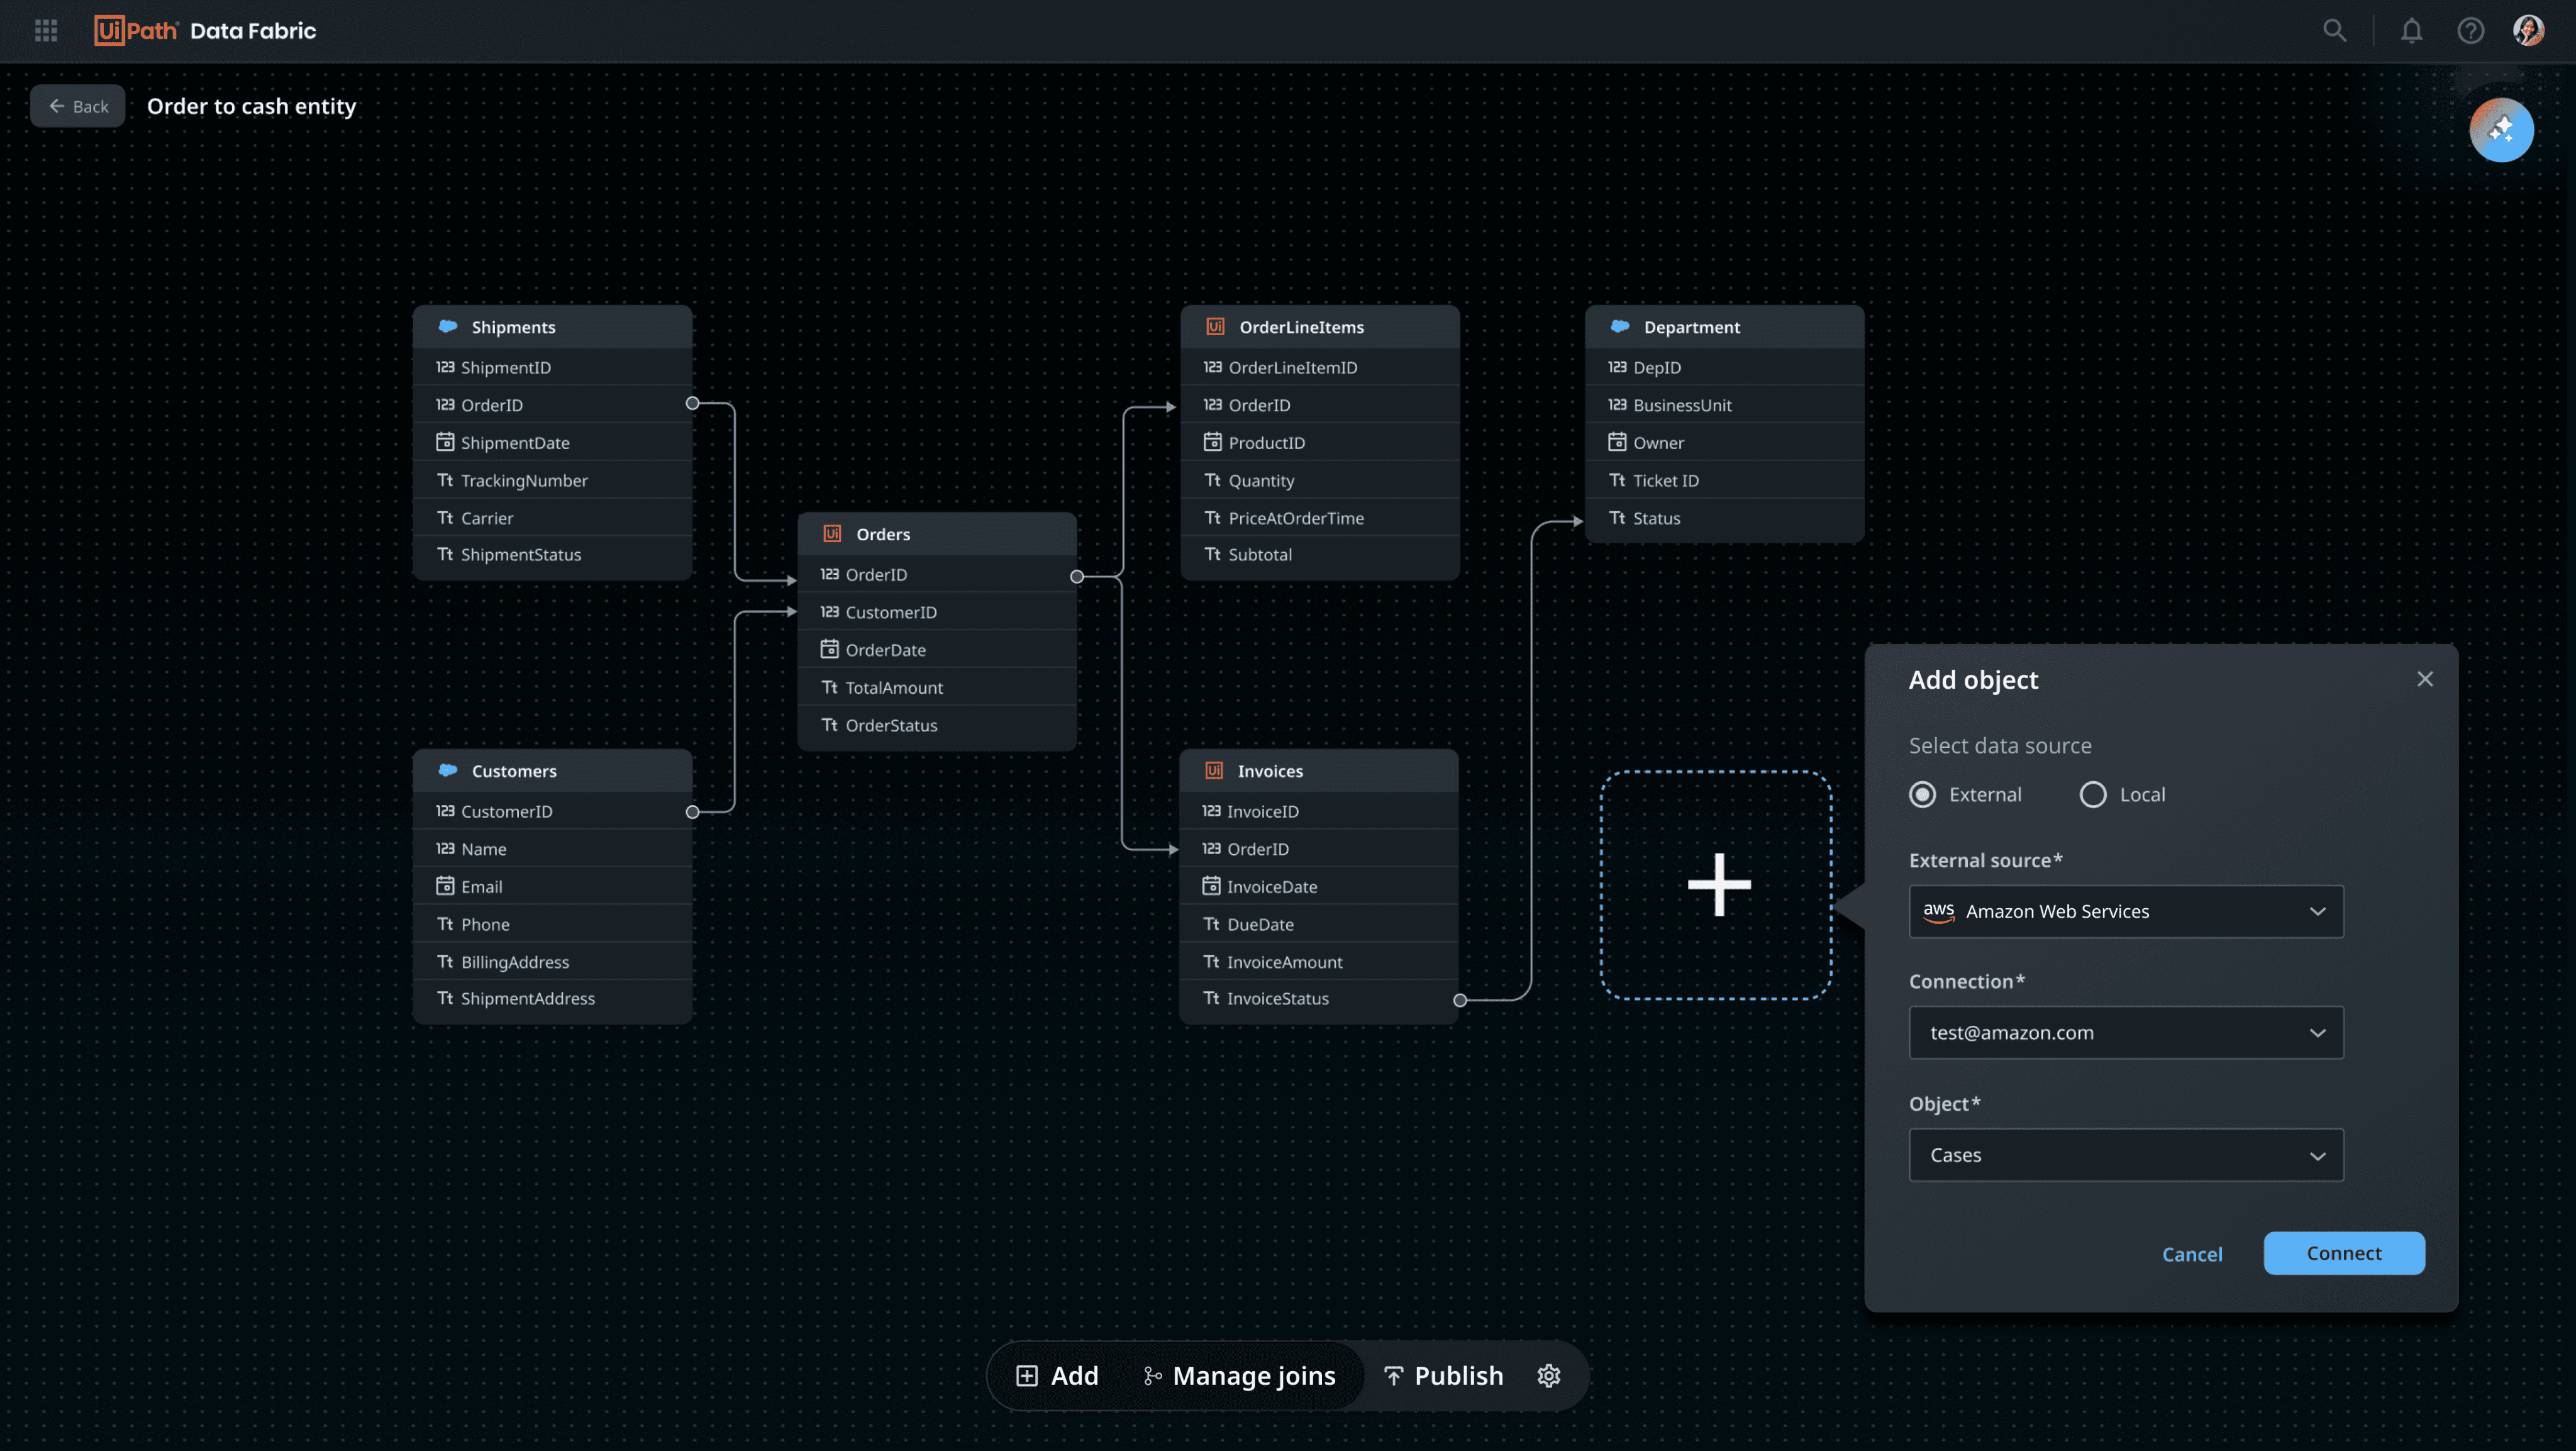
Public Preview Launch
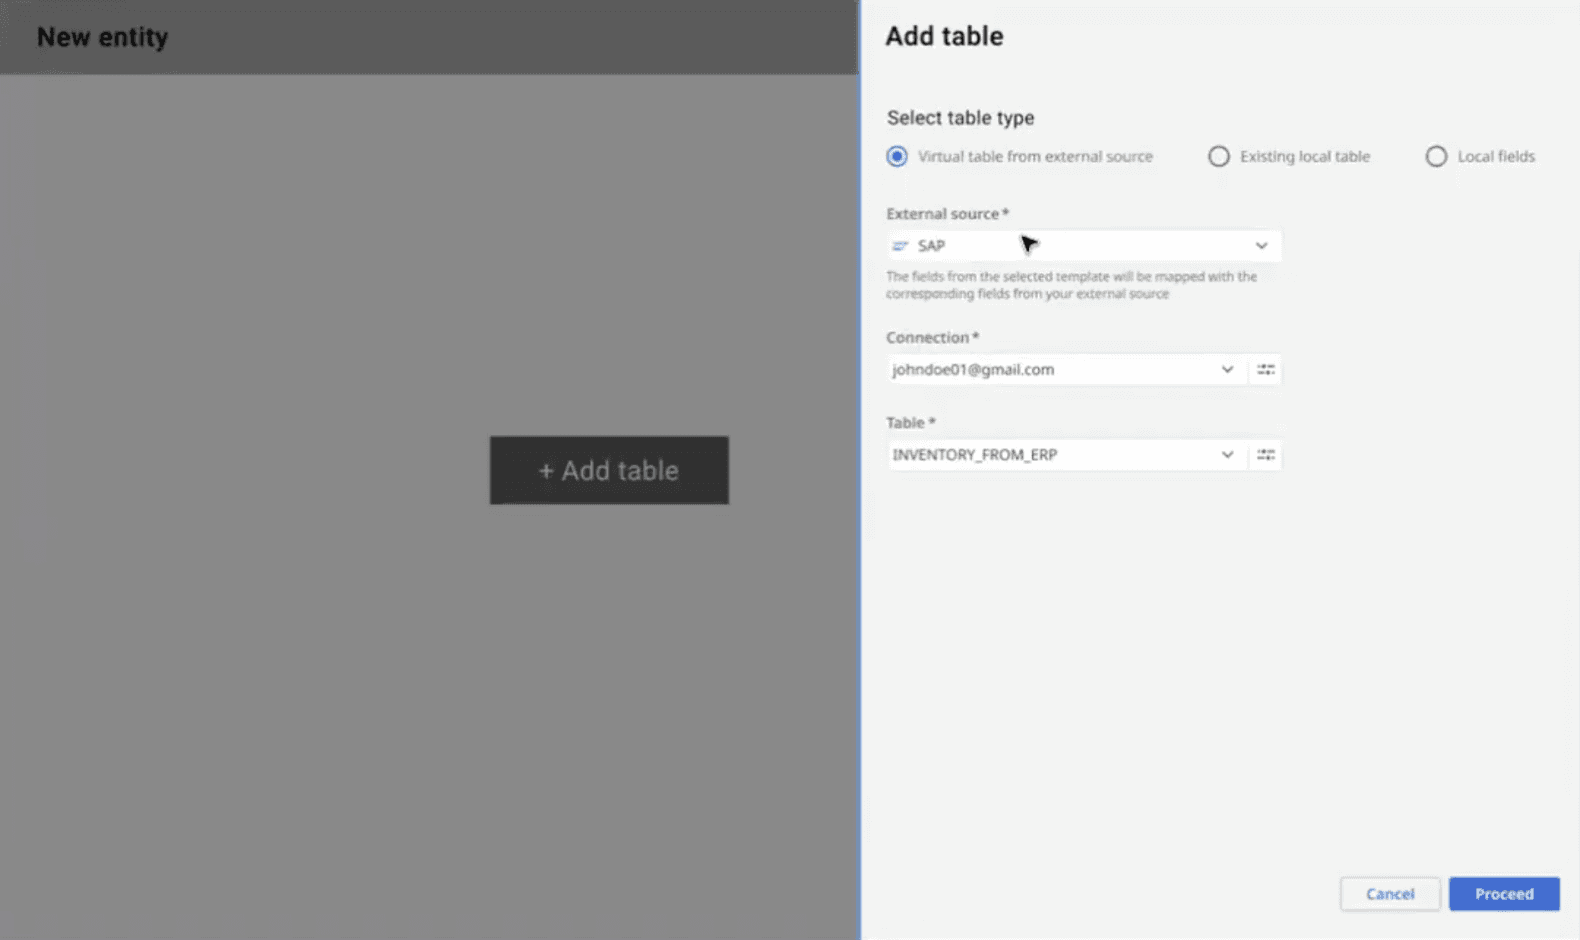
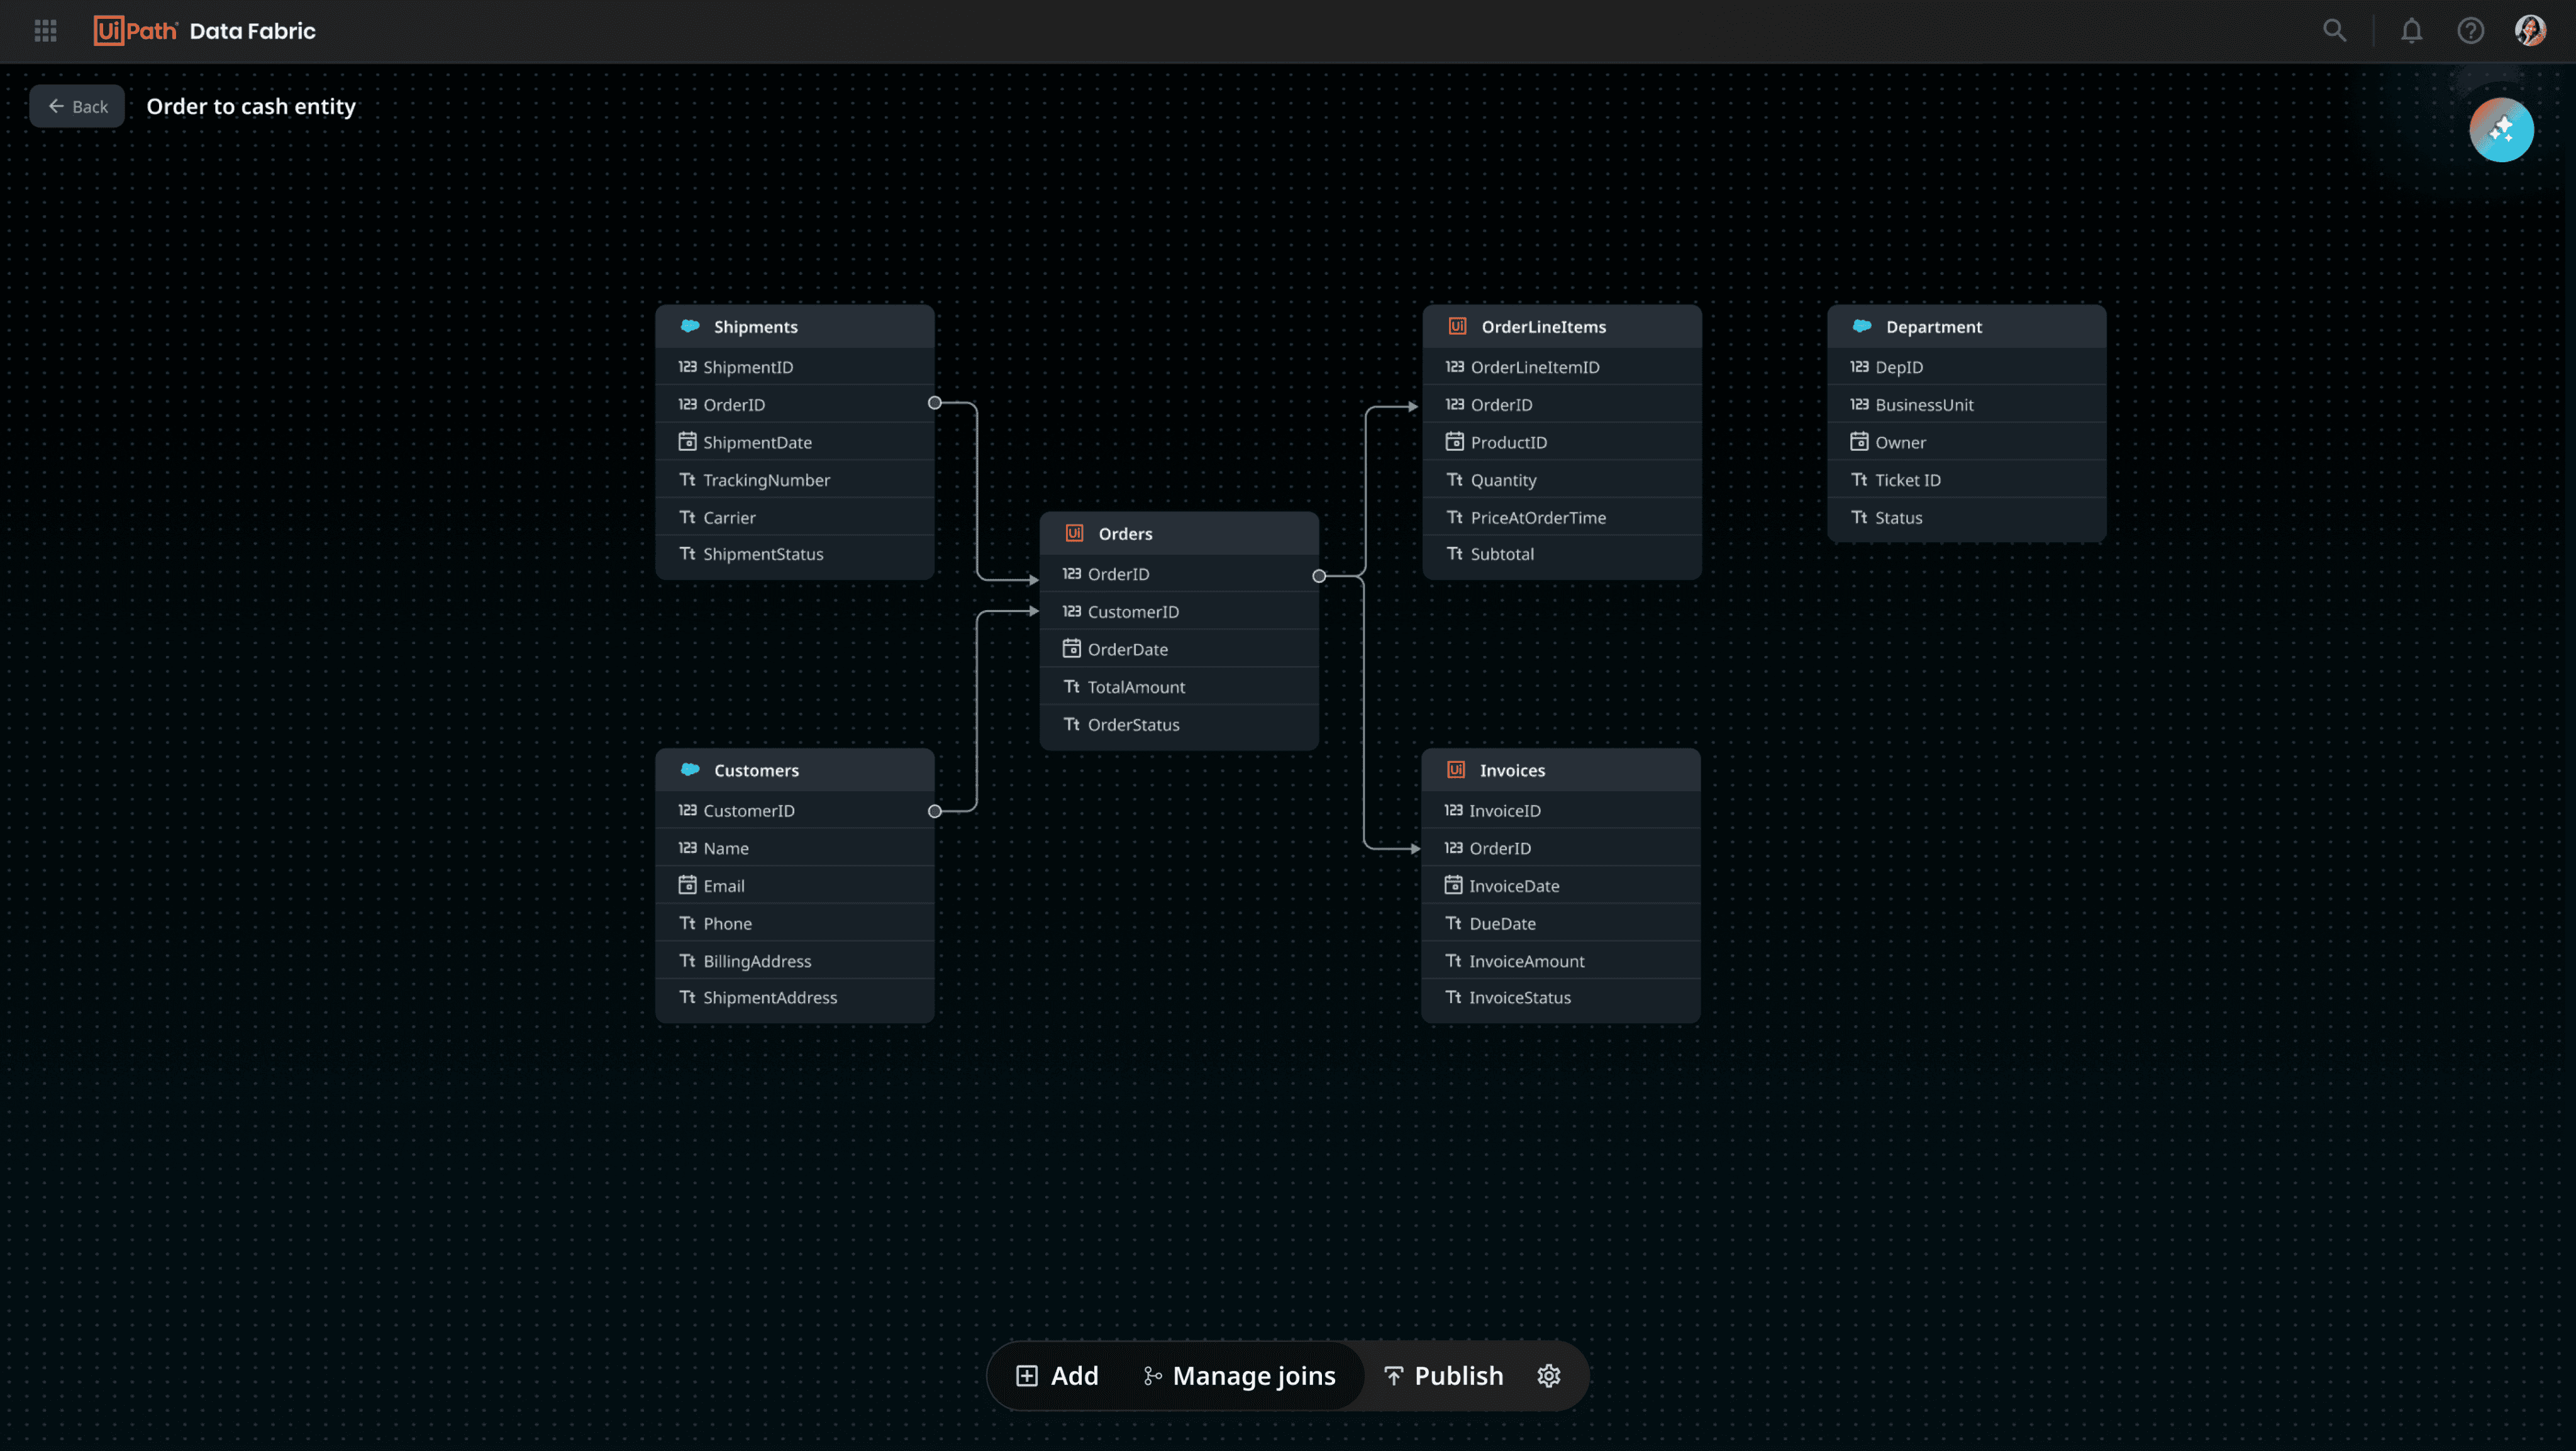
An infinite canvas where
users can add local object (local fields) or external objects (external fields)
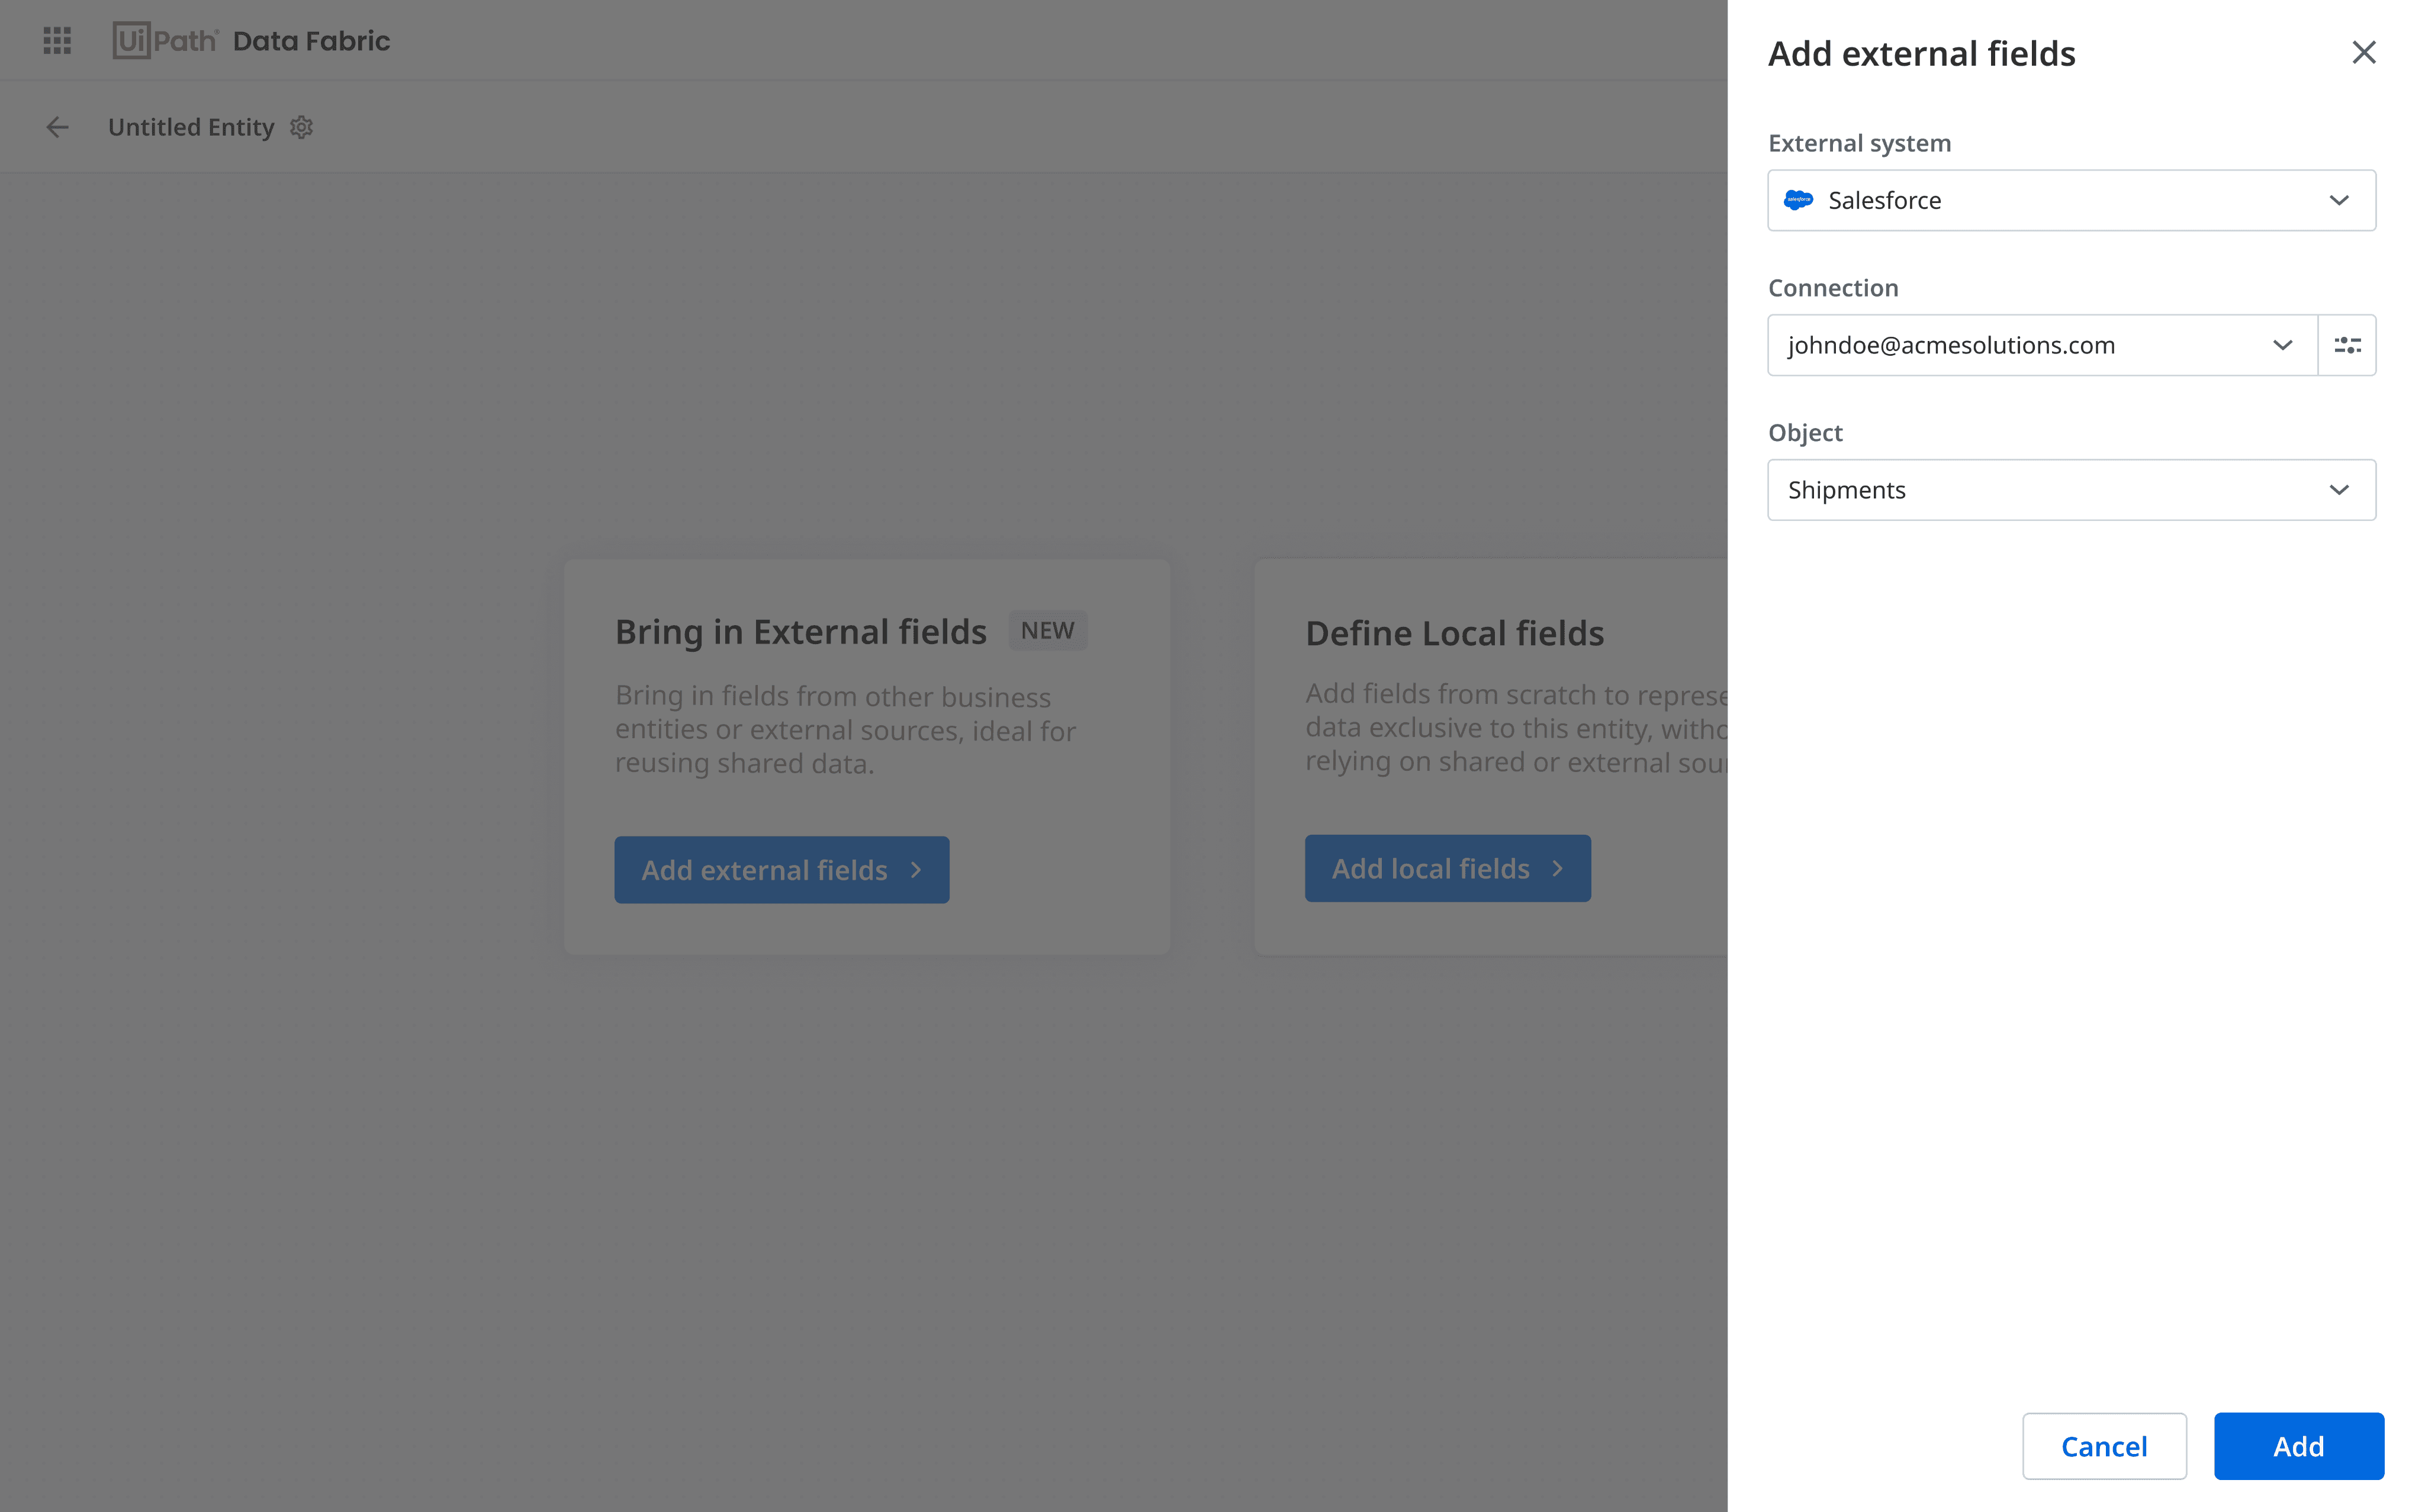
For adding an external object, users need to select the source and the connection / account linked to that source
Clicks on ‘Add external fields'
Configure basic entity details
like name, description, etc
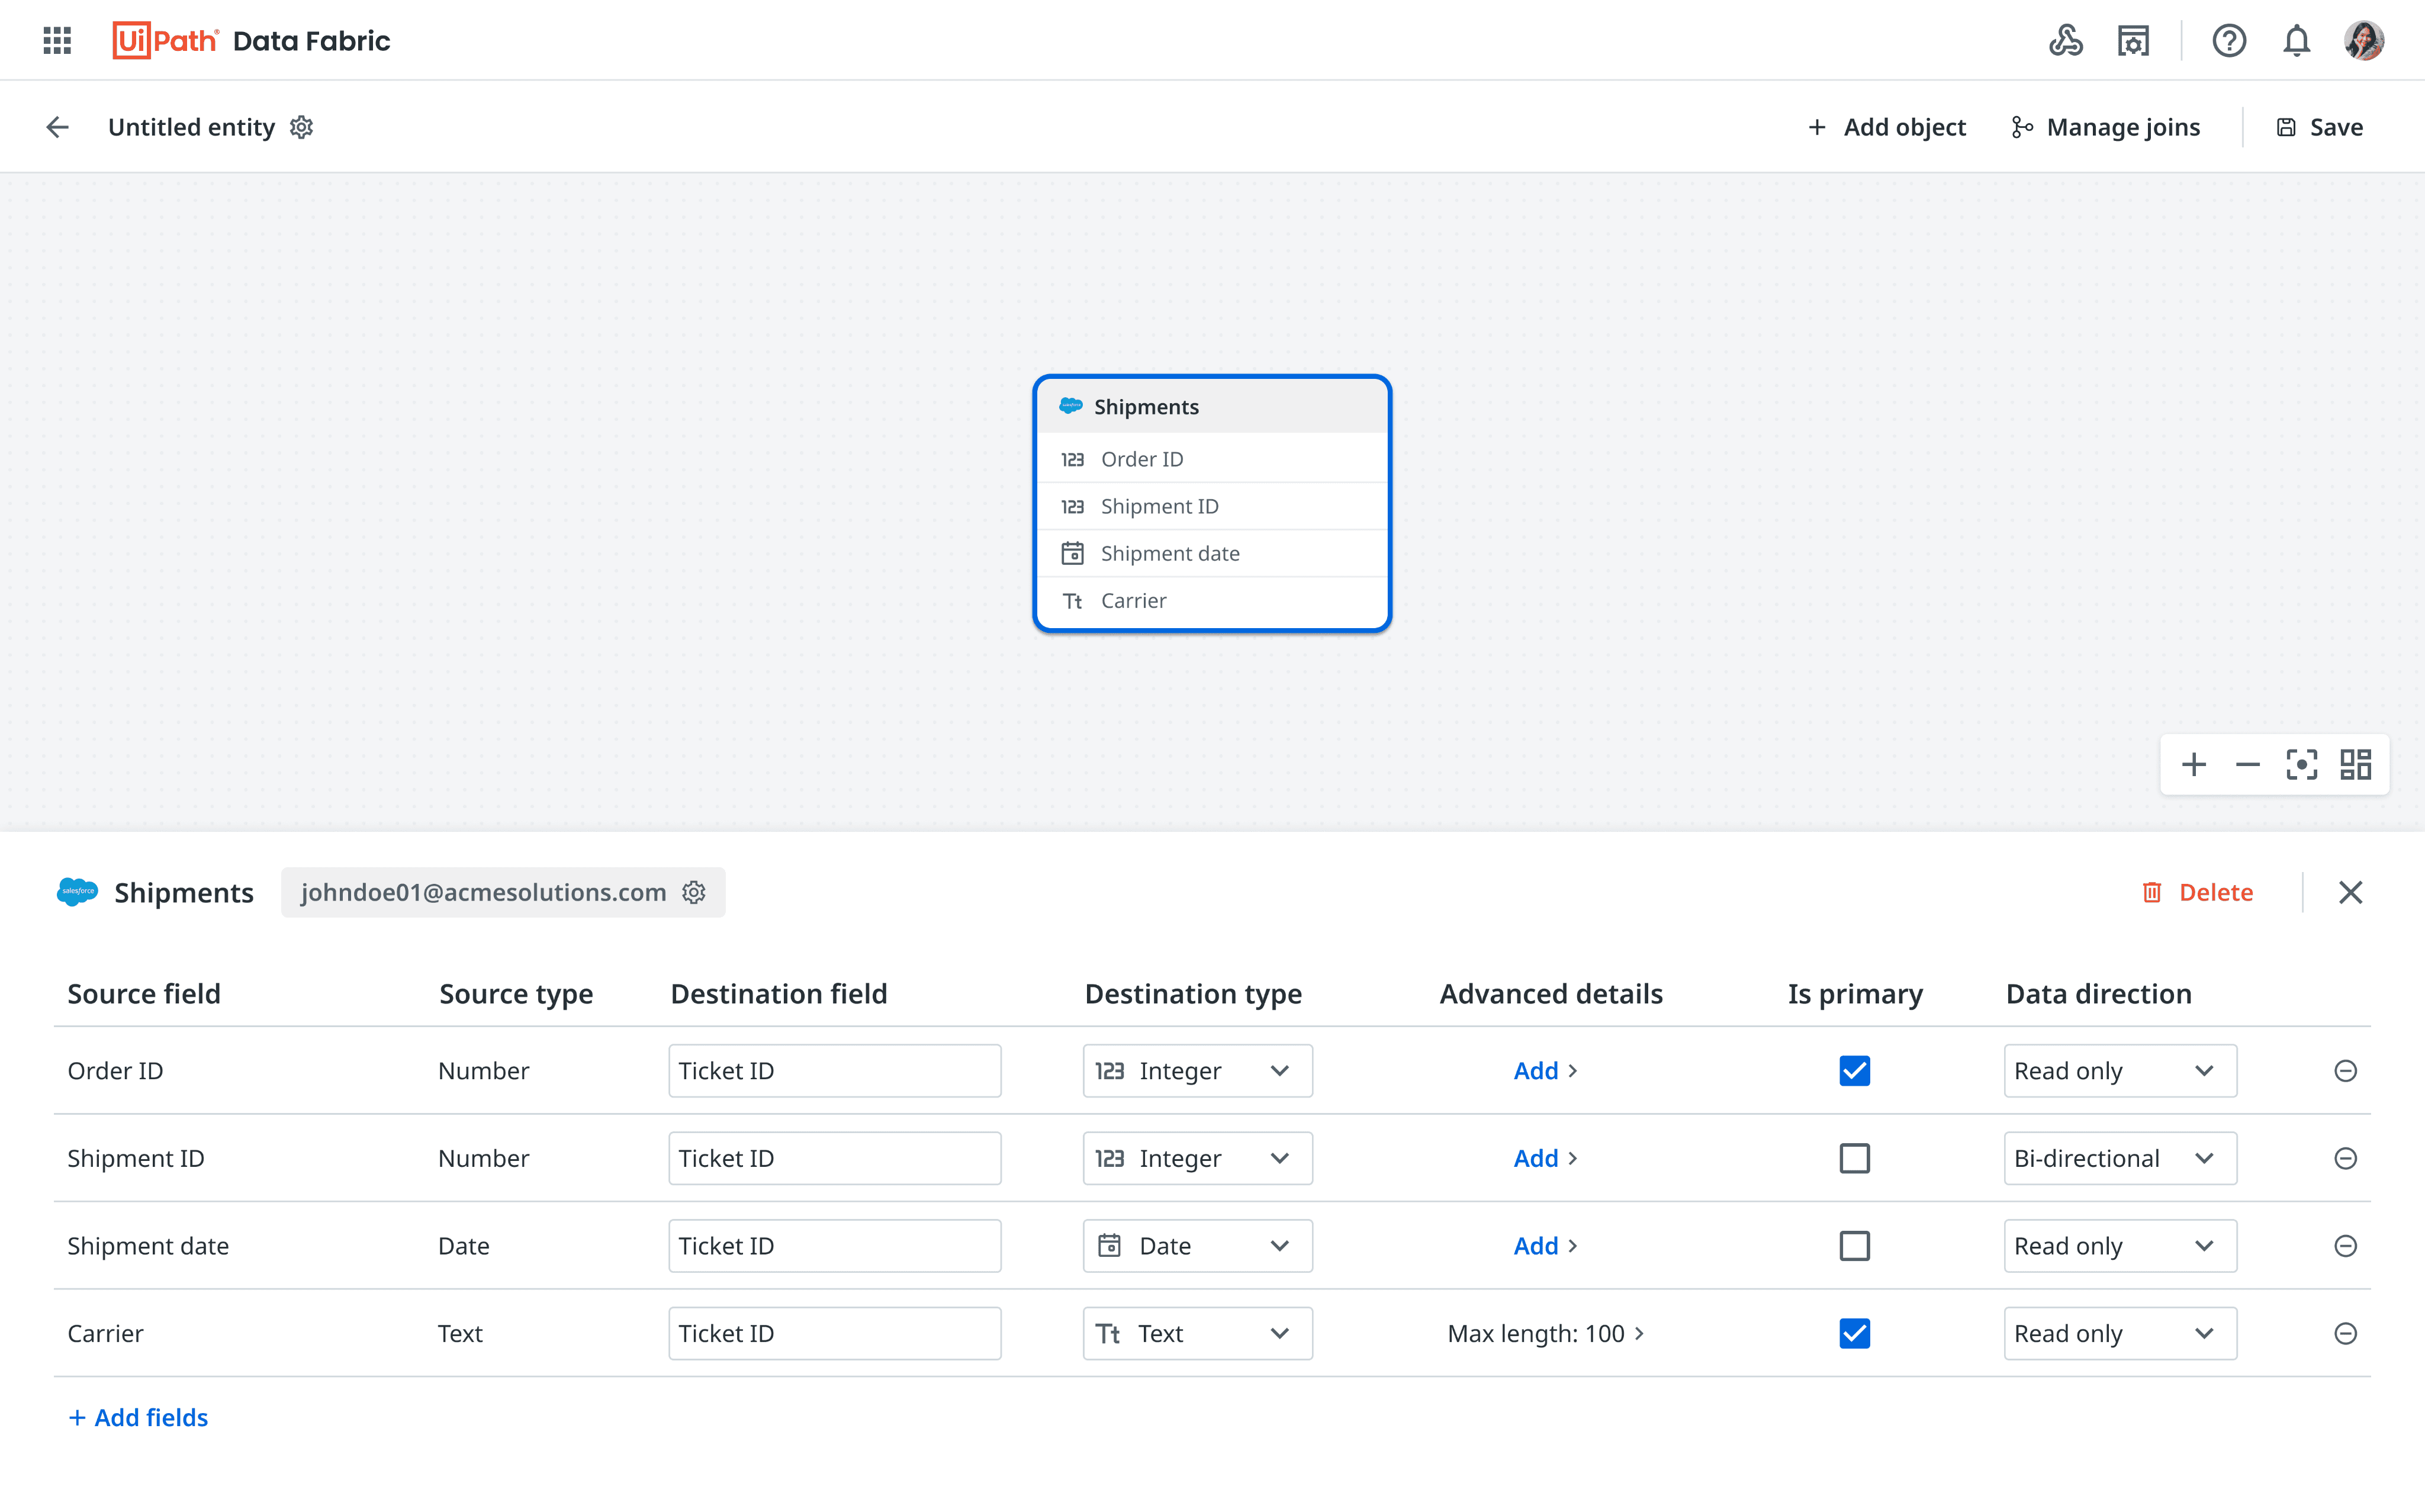
Destination type &
destination field
Connection / Account linked
to the external source. Users
can re-authorize or even switch their account by clicking on the settings icon
Users can select fields
available for this object,
add them in the entity &
configure field properties
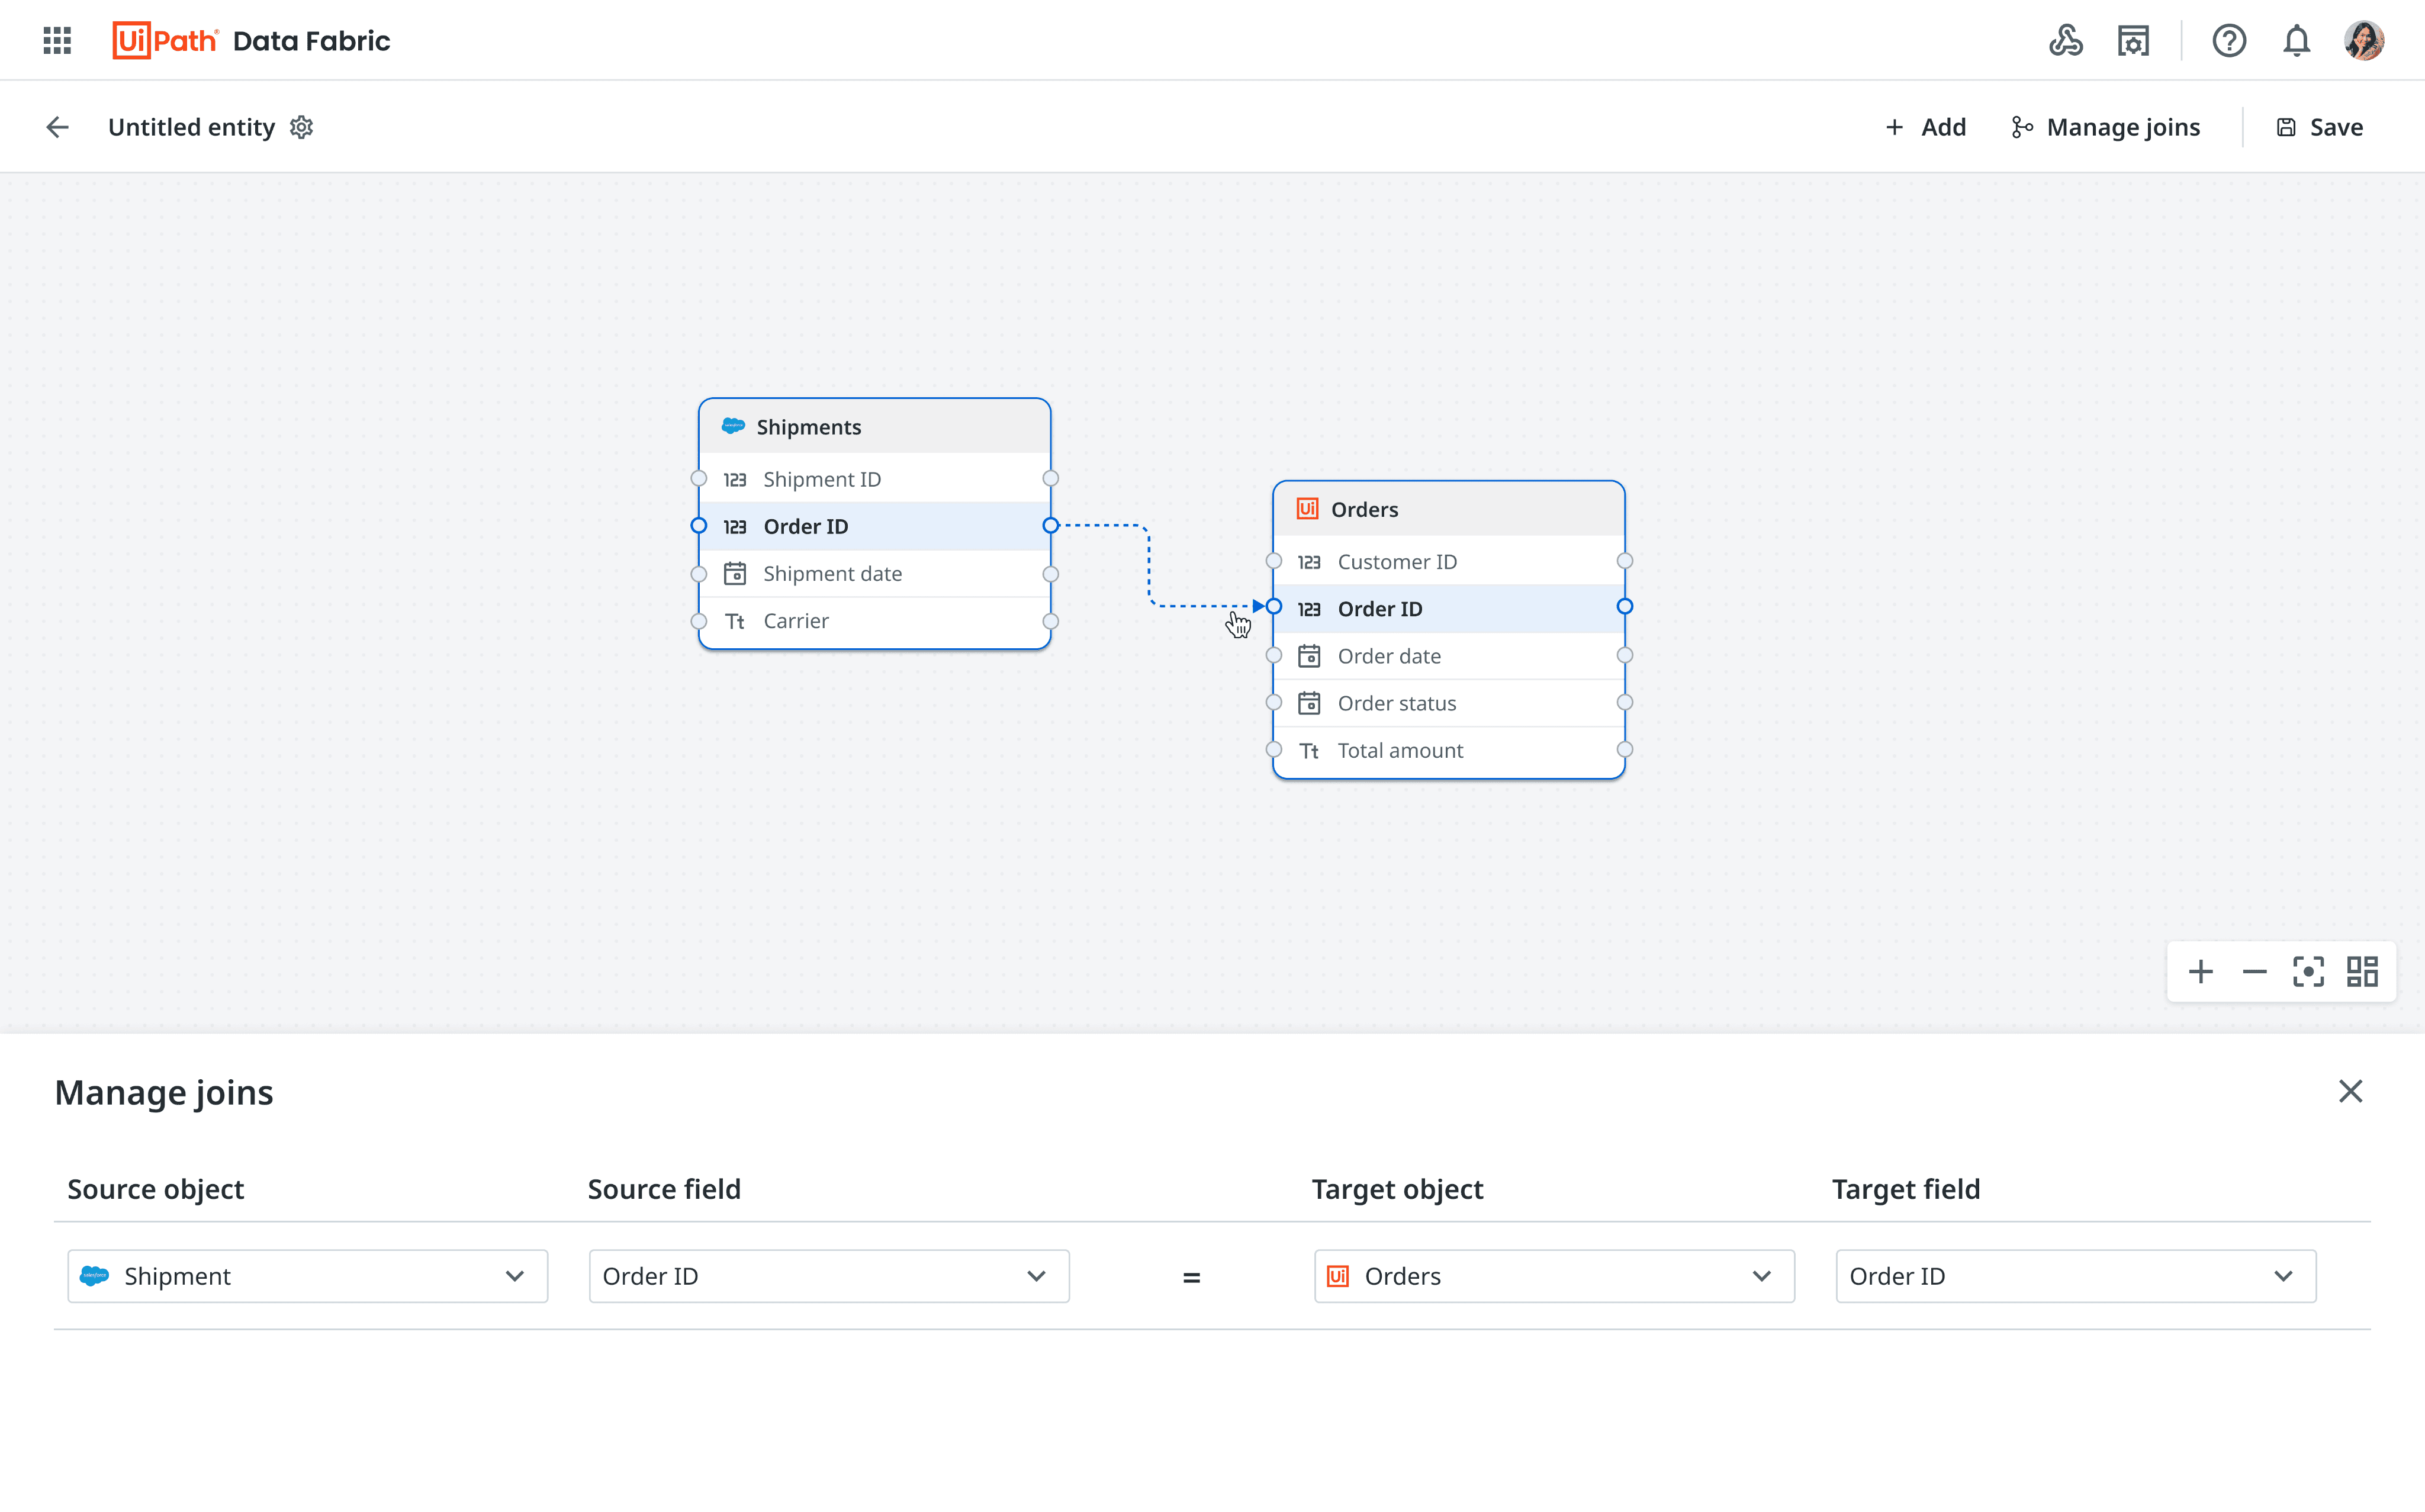
Users can drag an arrow through these nodes & connect it to the node of the other object in order to create a join
Alternatively, they can also click on manage join on top nav to open the ‘Manage join’ section - here they can select the fields for which they want to define a join
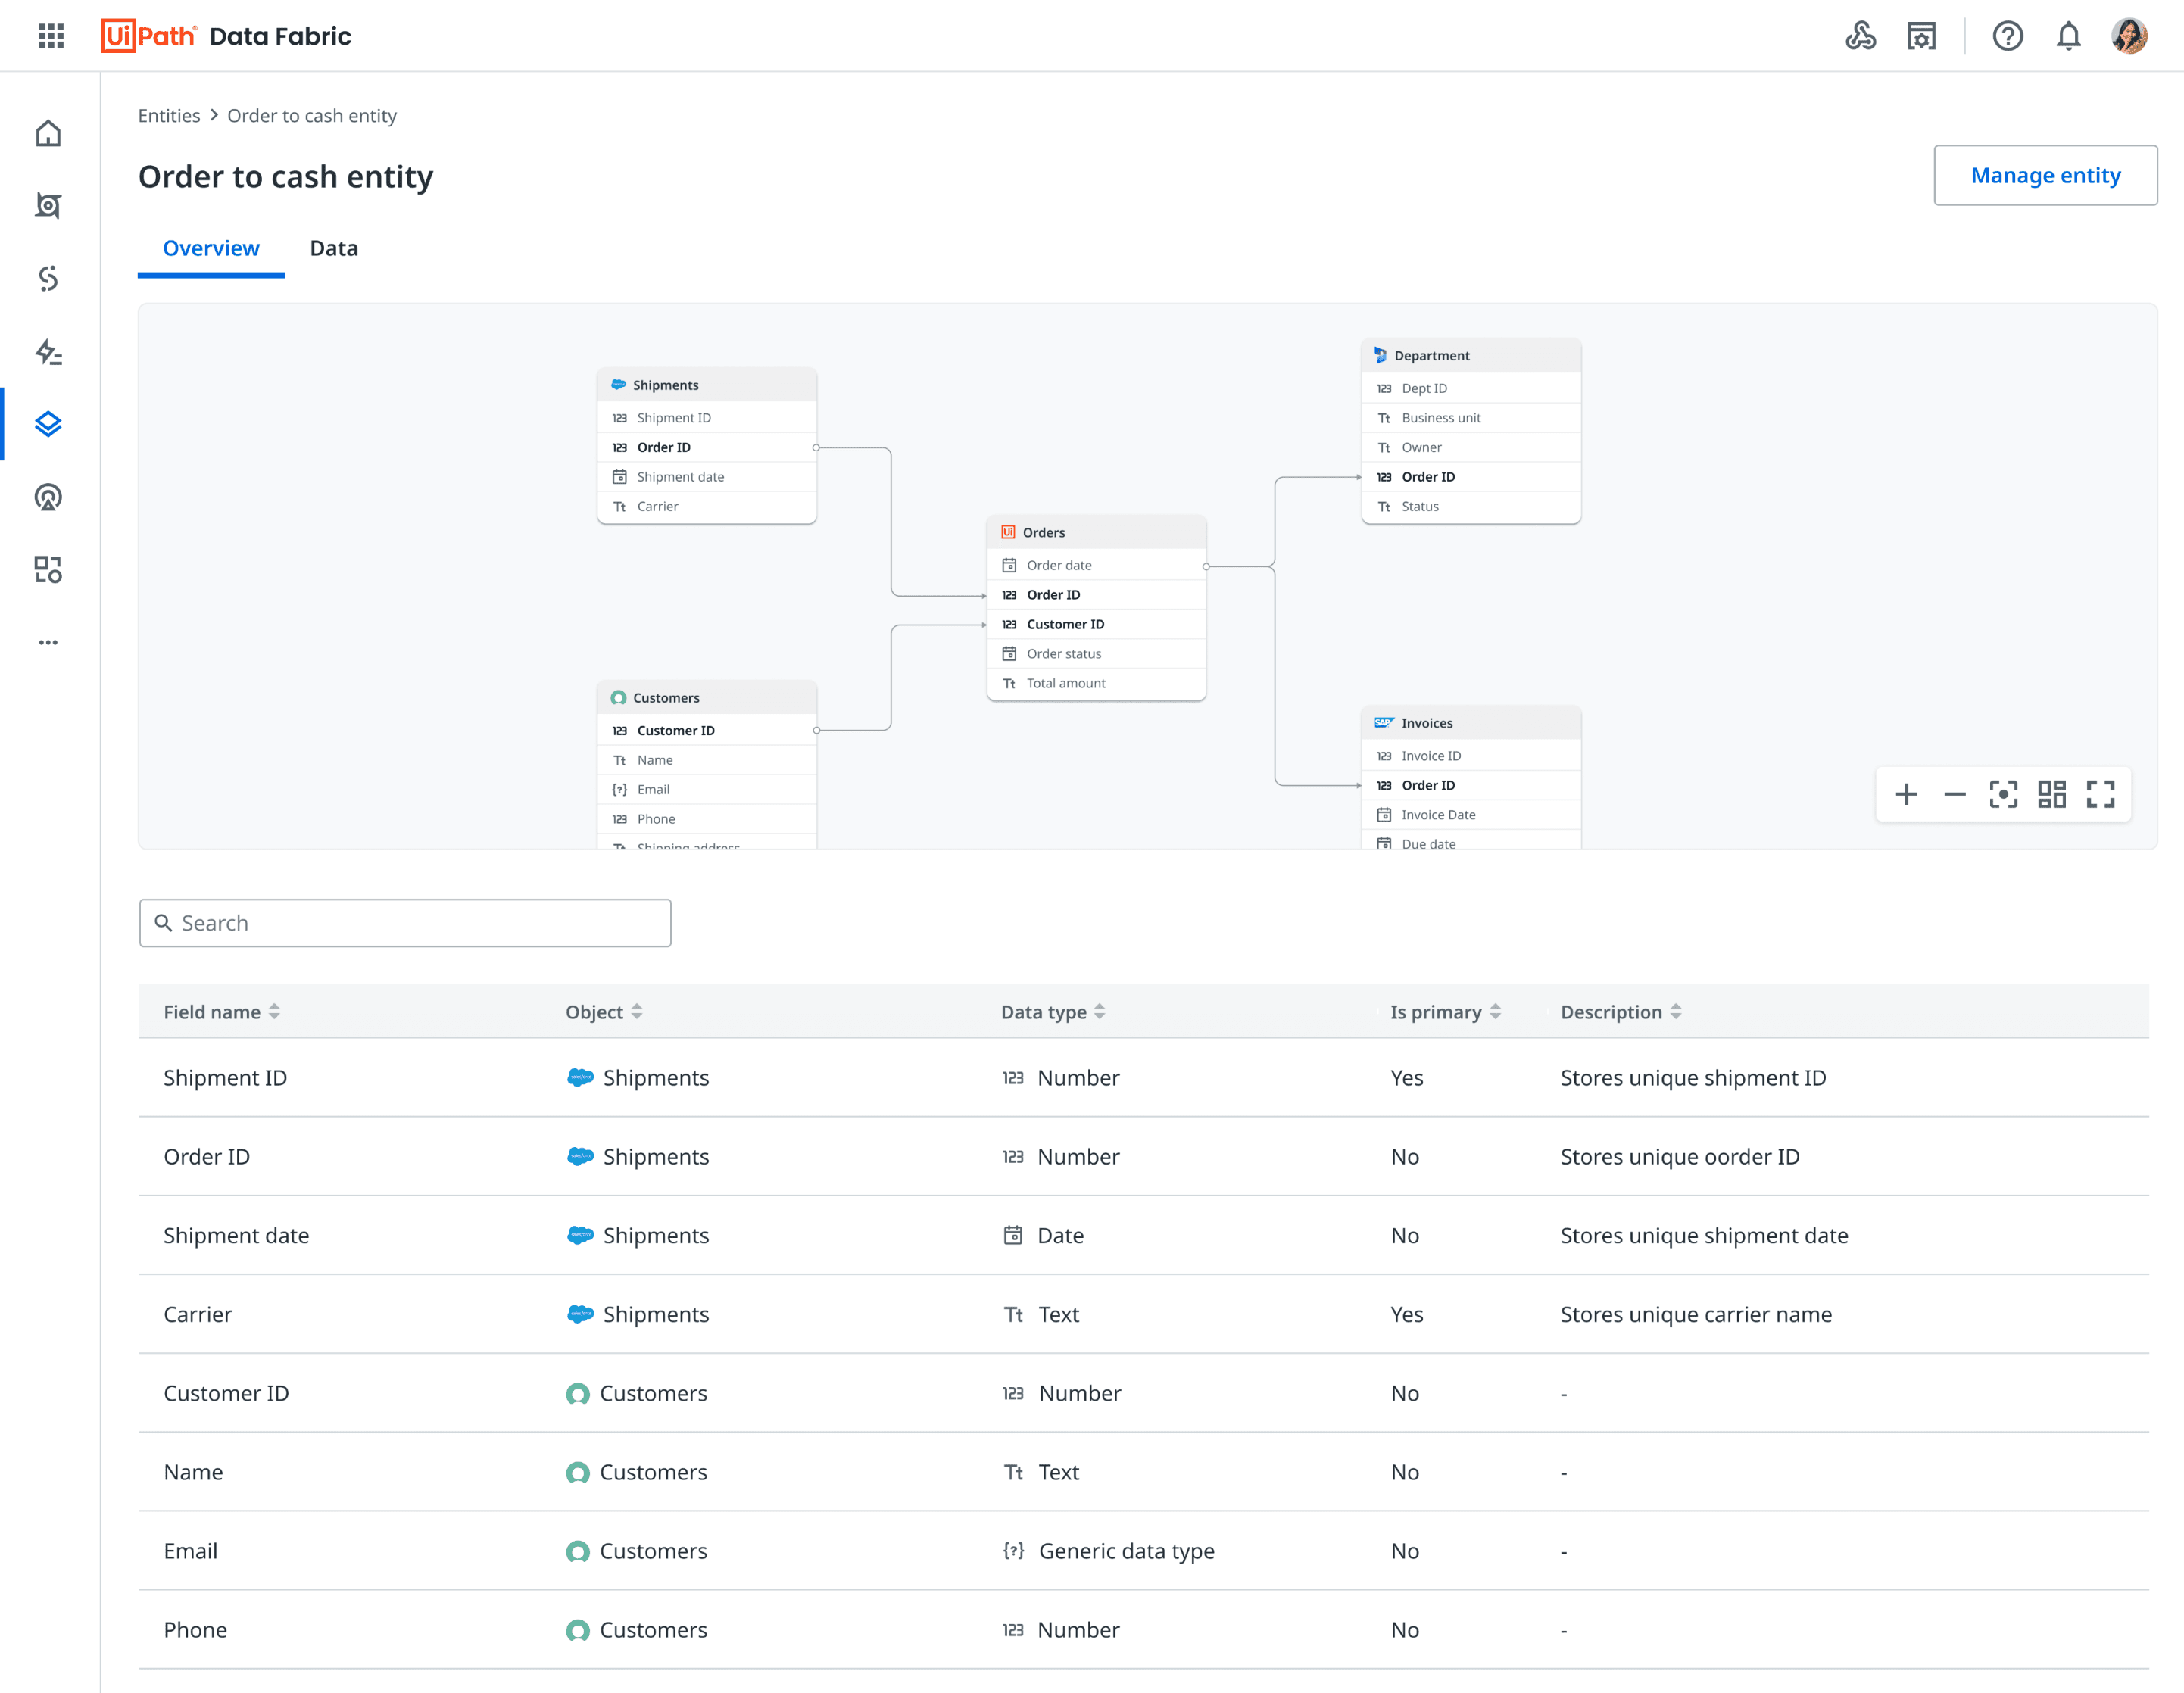
The overview tab consists of
a summary of the entity.
While, the data tab is used to
read data and write data
A read only view of all the objects present in the entity
Taken users back to the canvas view to edit the entity
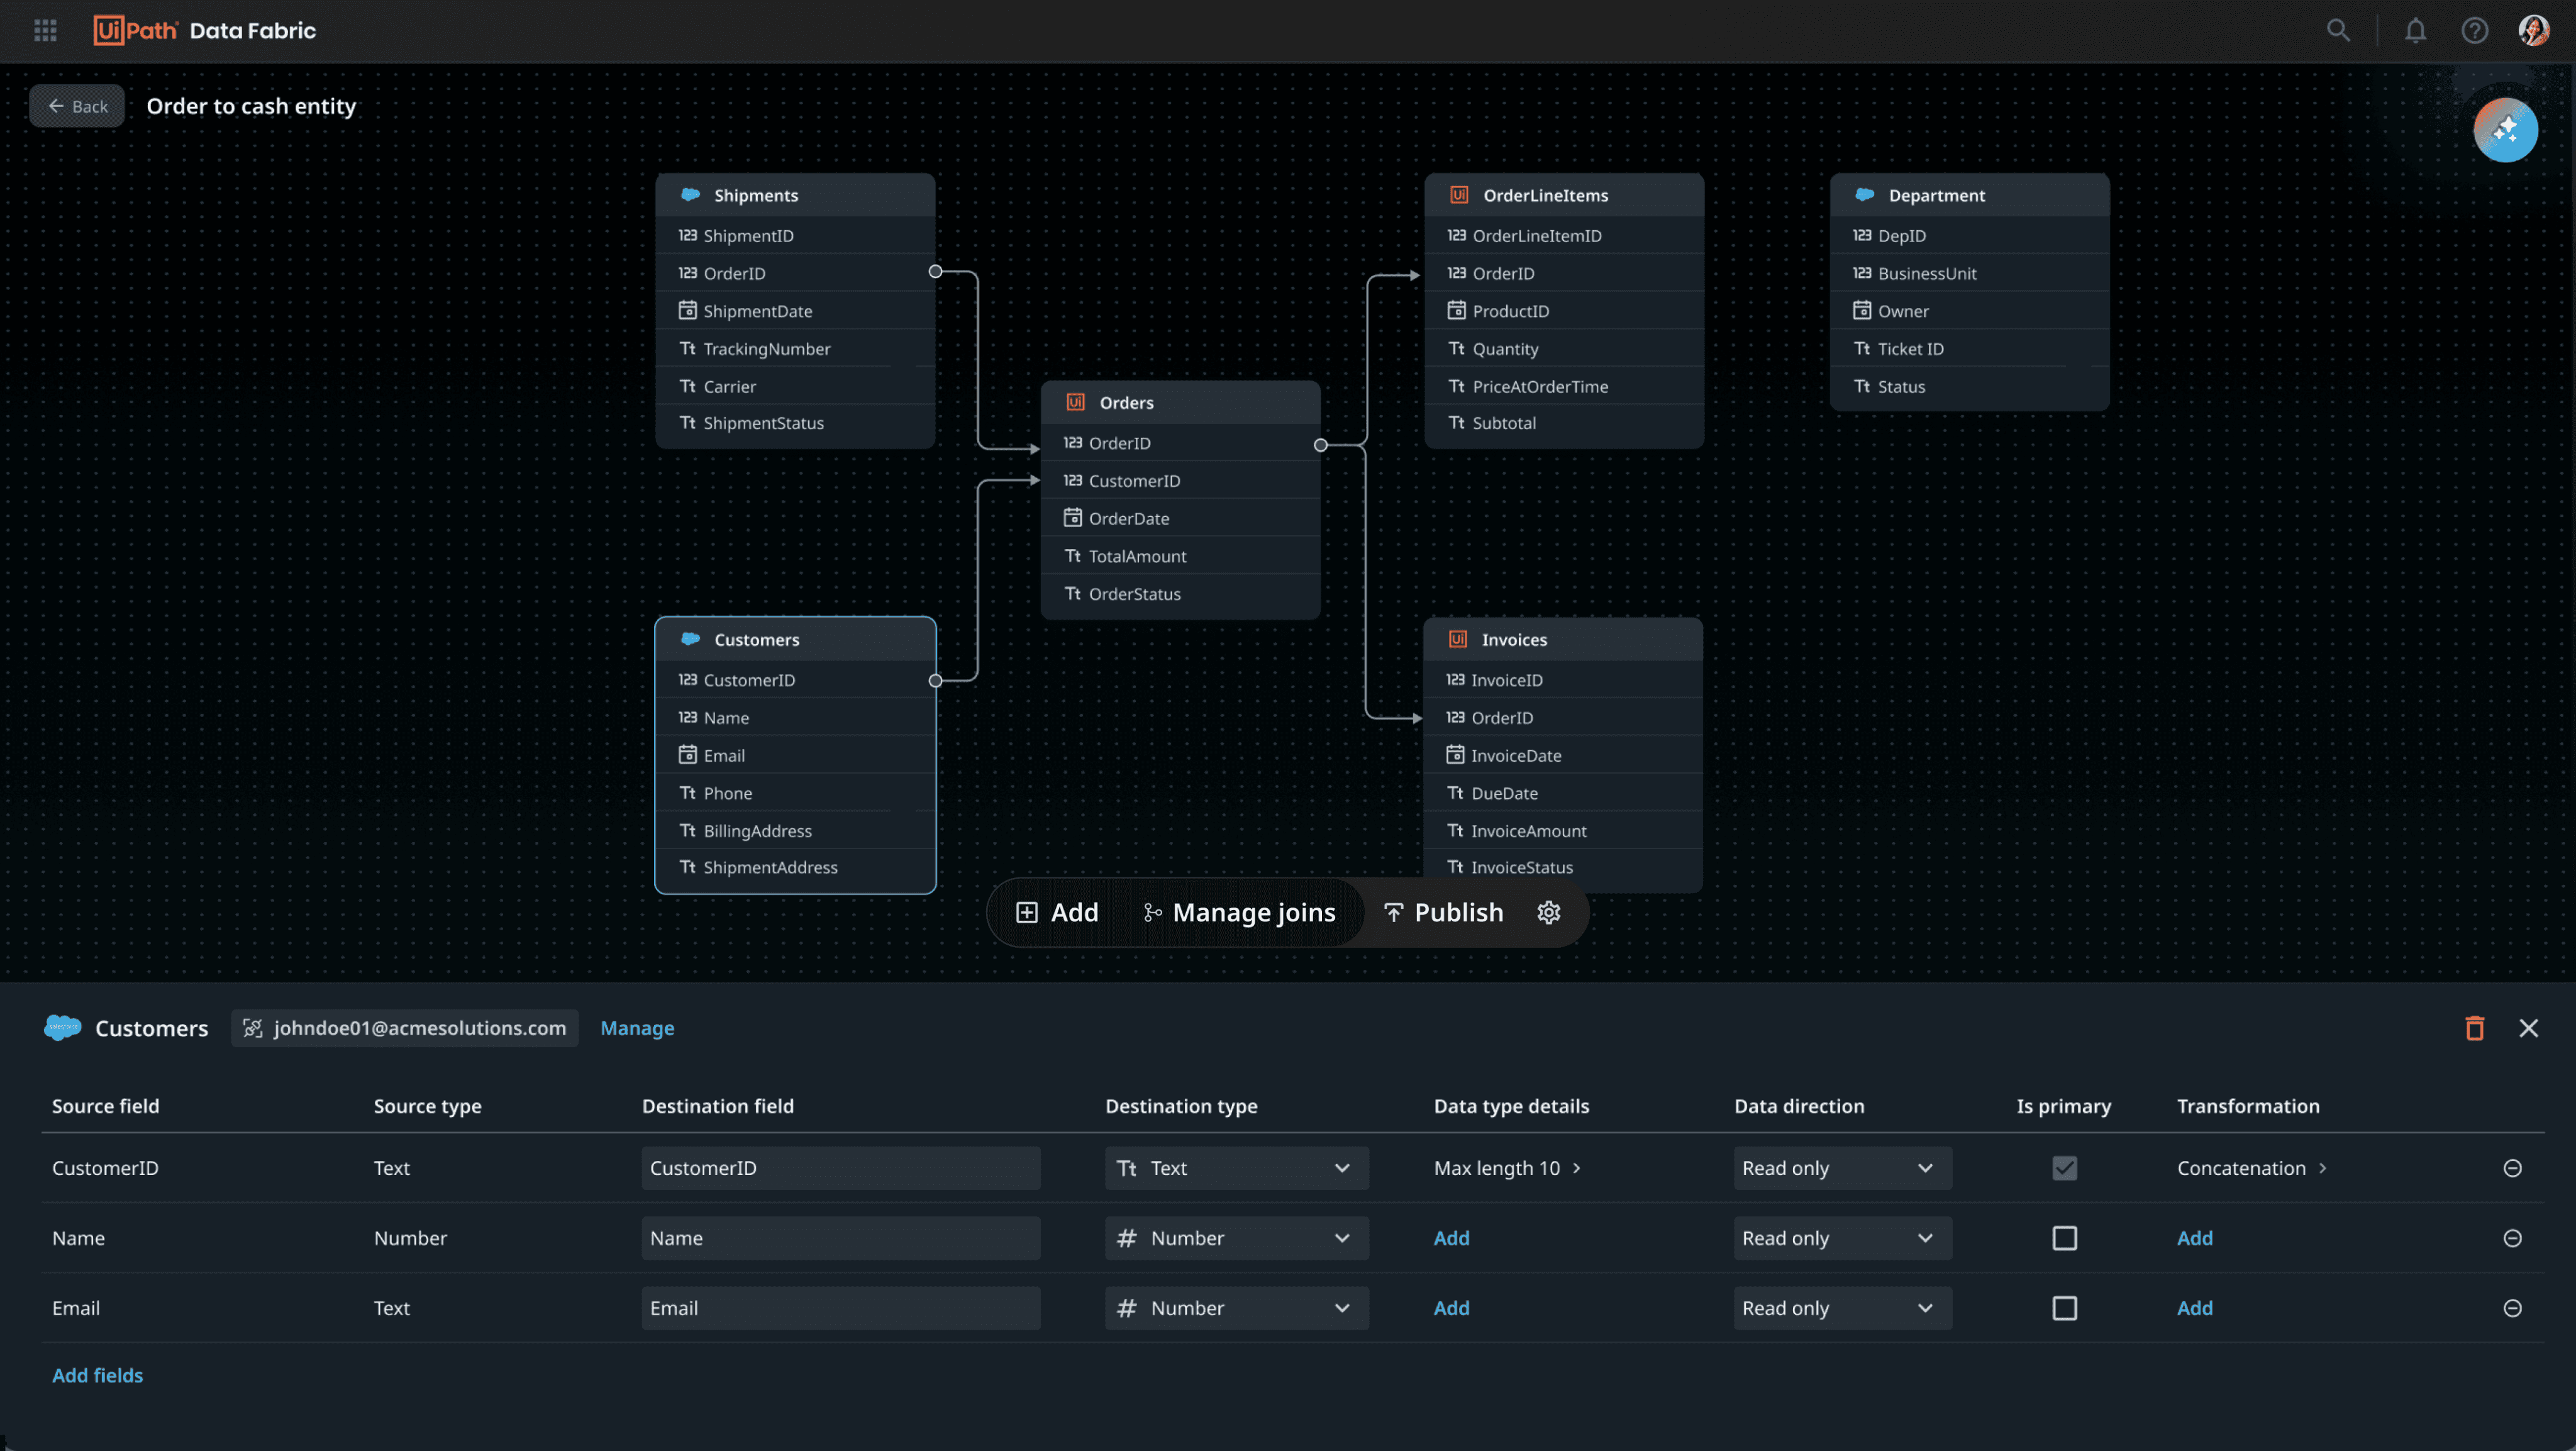
Feedback - Post Public Preview
60% customers
Do not configure additional properties. They would just want to update the destination name and destinationtype
30% customers
Have an Agentic AI usecase. They are also curious to leverage UiPath Autopilot for entity modeling
40% customers
Have usecases where they would need transformation pipelines for their entities
70% customers
Would prefer interactions through ERD. They do not want to use the bottom panel for managing fields and field properties
Canvas Approach 2.0
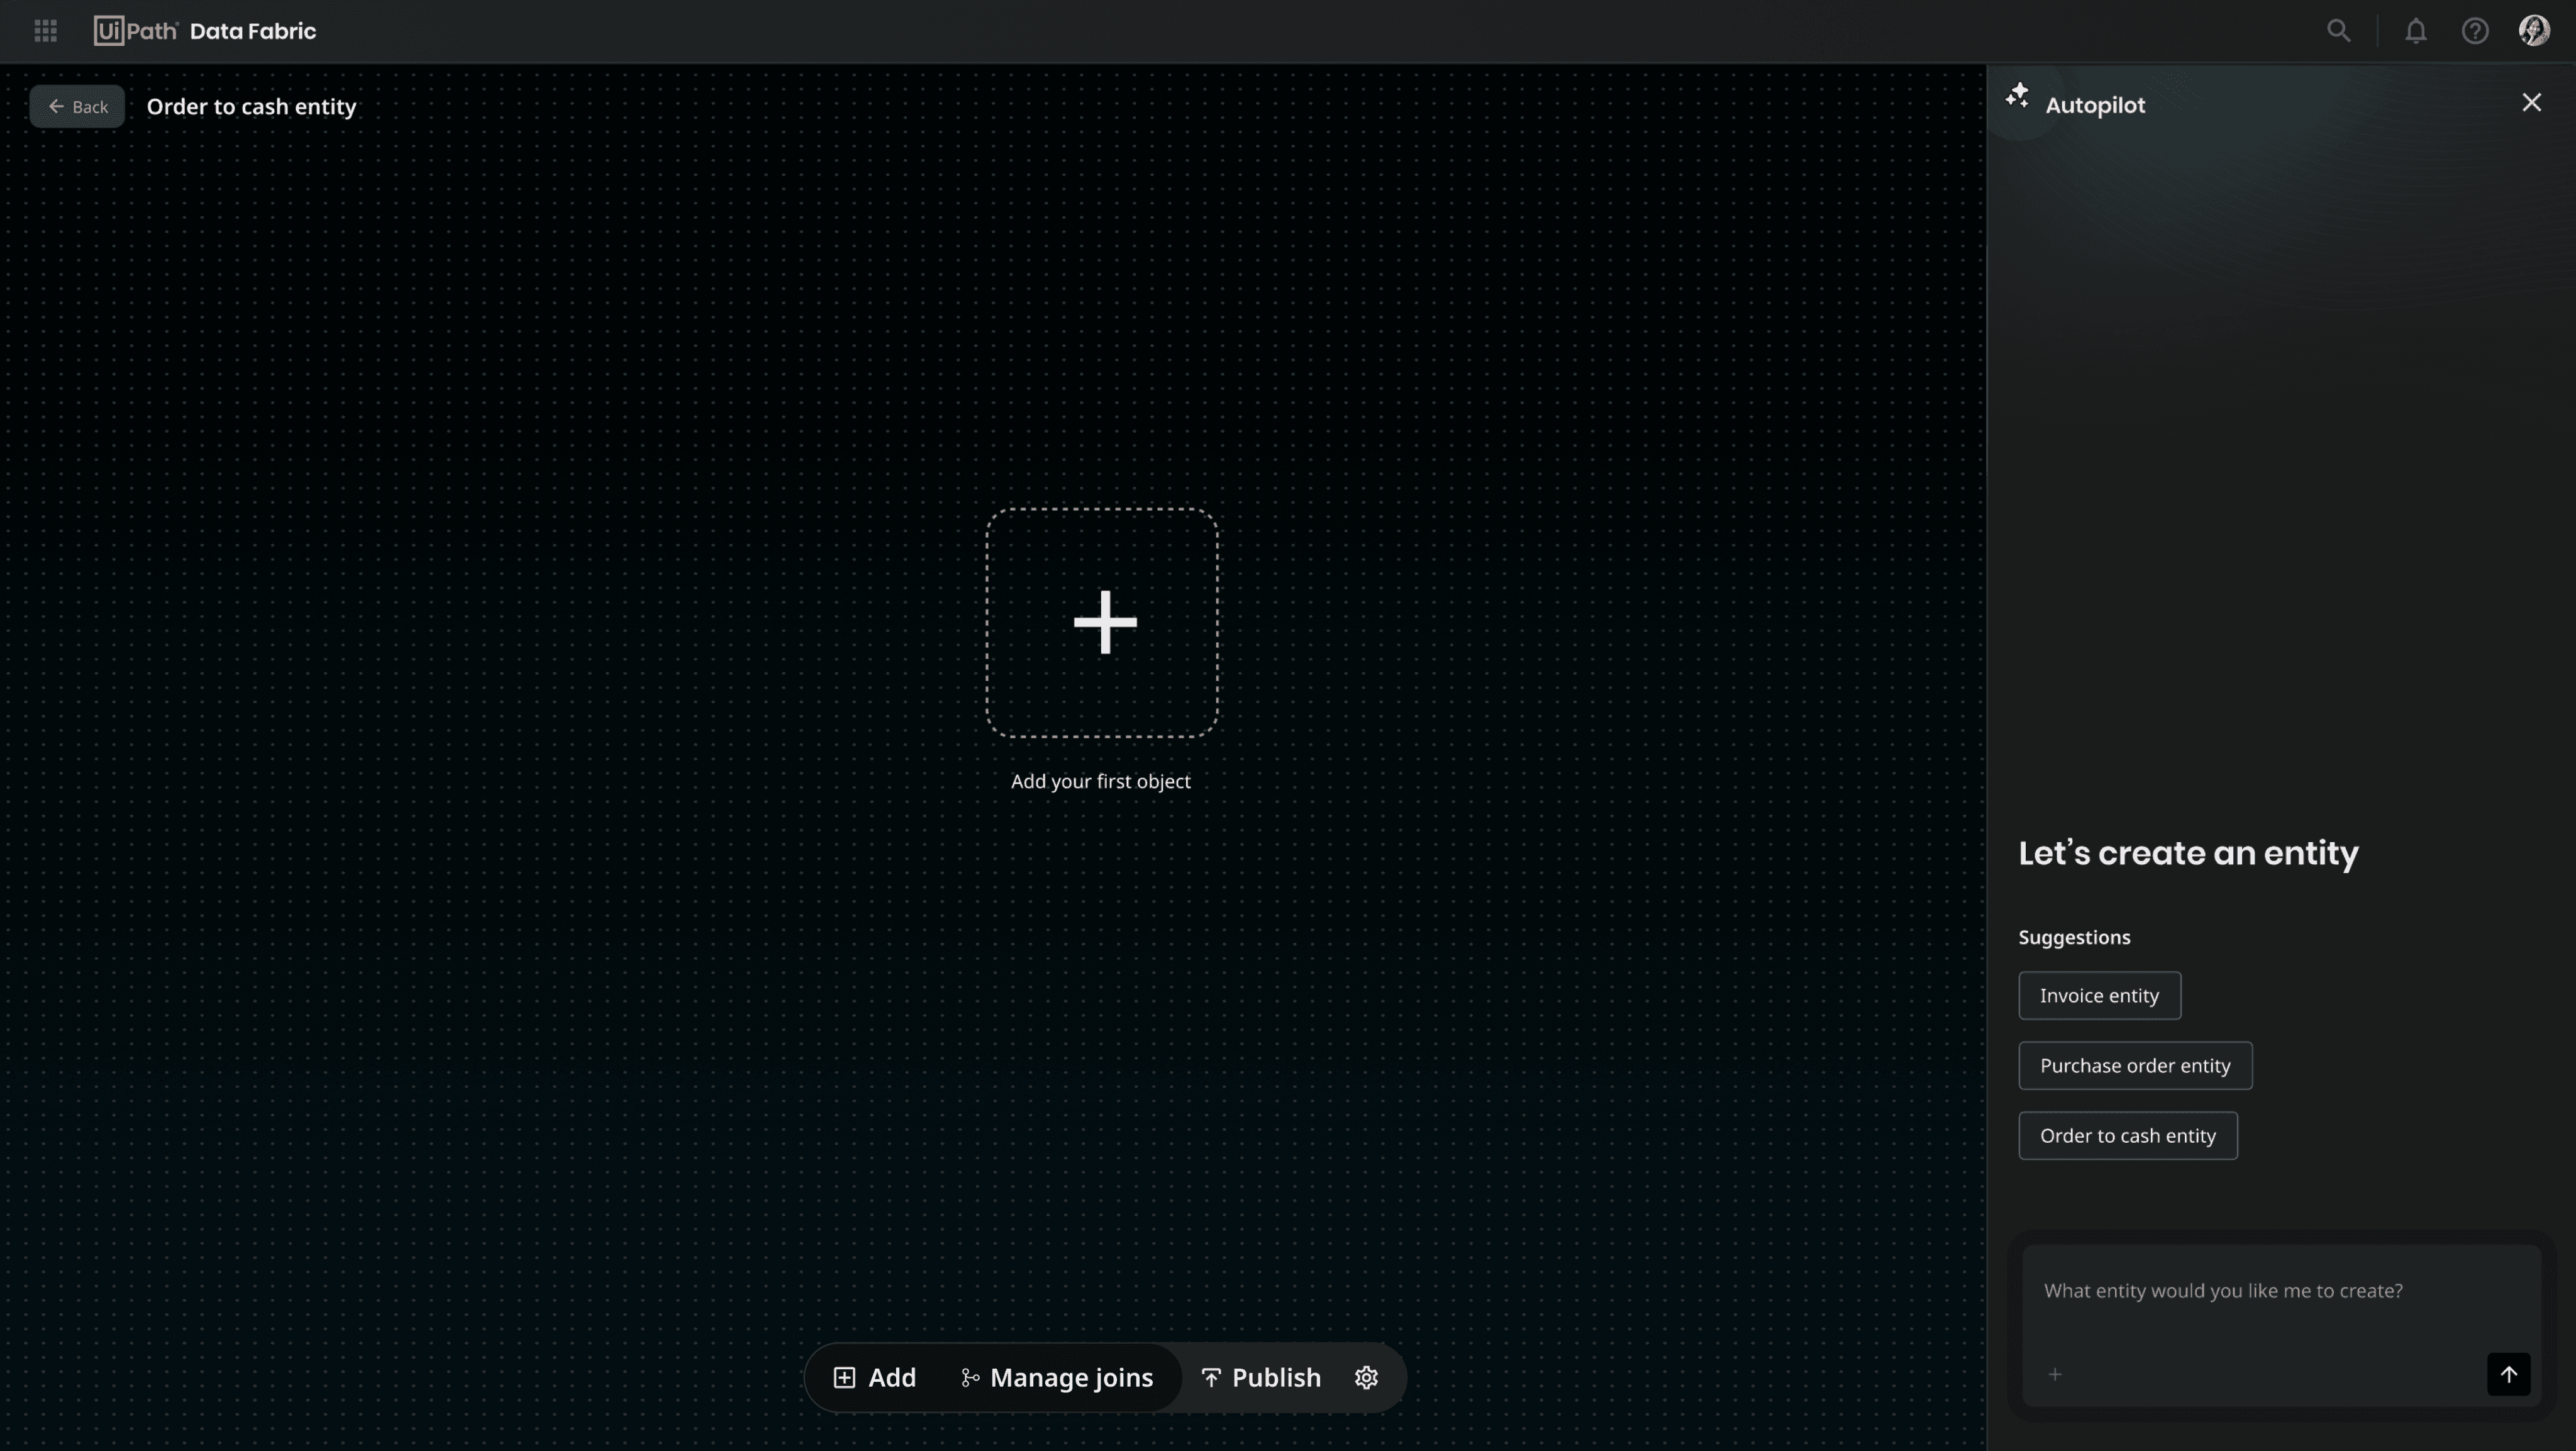
A floating action bar - Saves space at the top resulting in more working area
A minimal top nav - Saves
space at the top resulting
in more working area
Reducing the usage of panels by using contextual pop-overs. This helps in reducing scattered touchpoints for users when their focus should be on the canvas
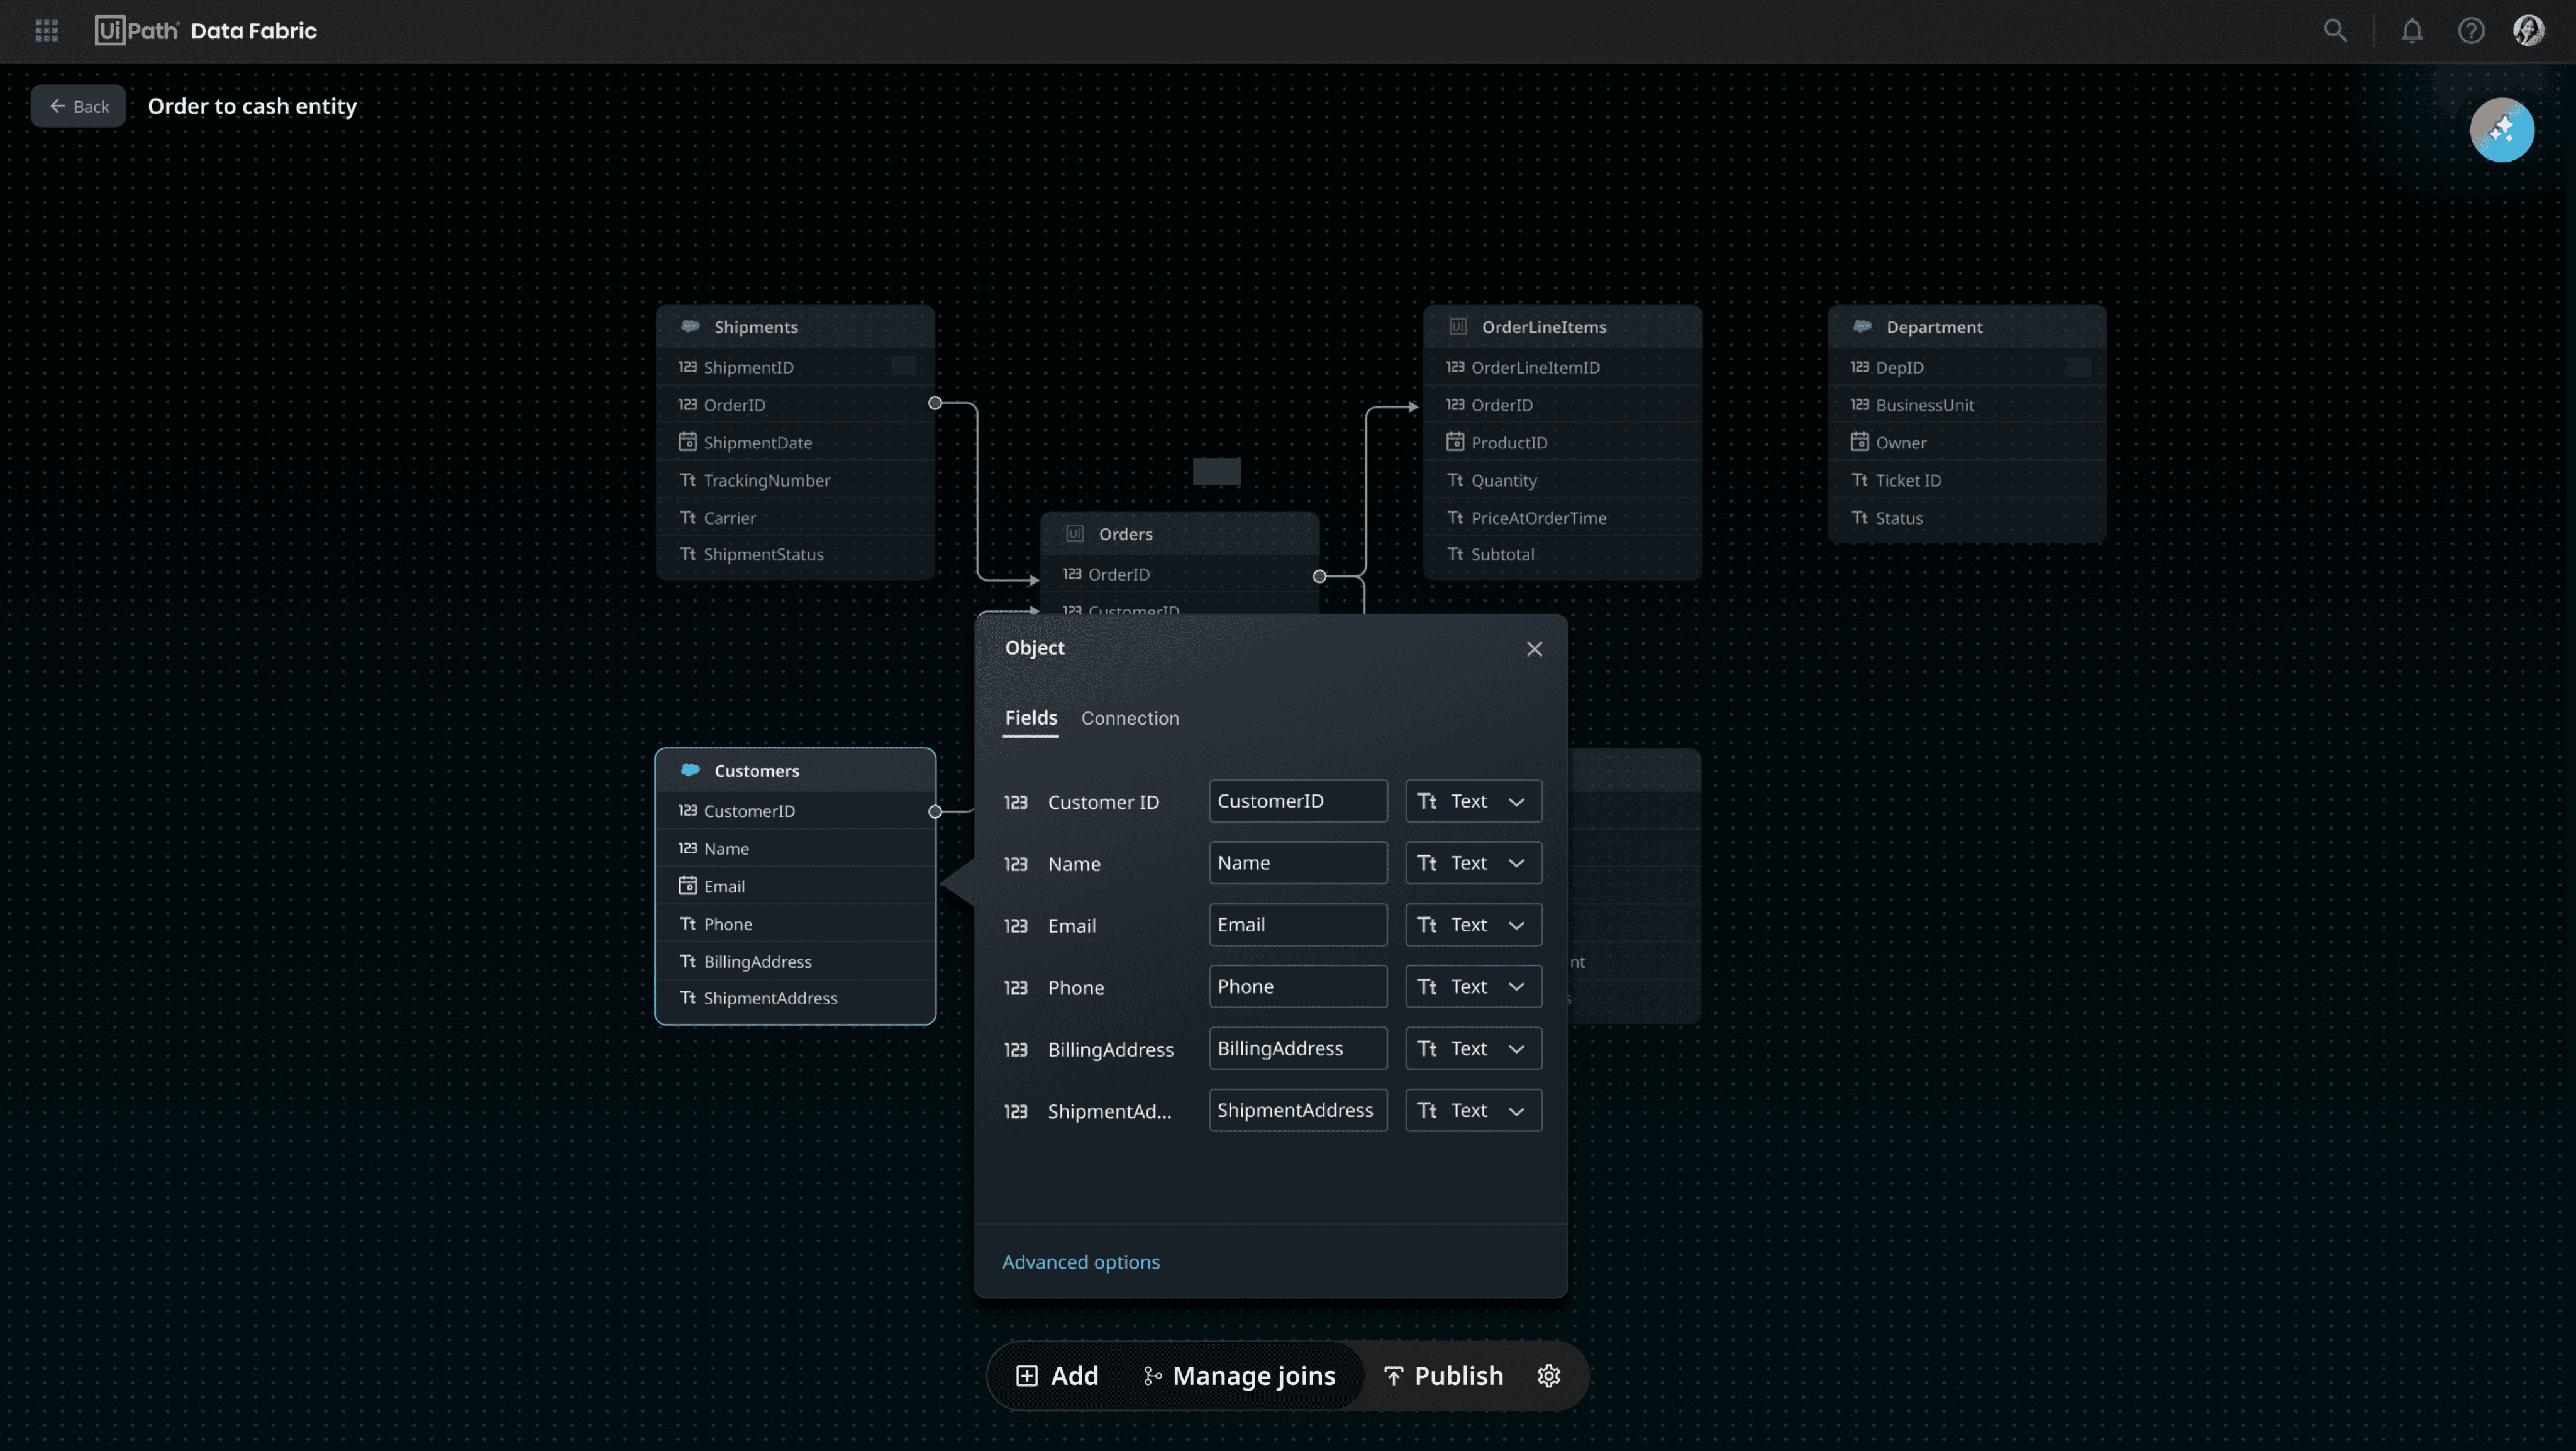
Clicking on advanced options
will open up the bottom panel
where users can see all the
additional field properties
As most users only configure destination field name and destination type, I intended to only show these important properties upfront
Additional properties
Clicks on ‘Advance options'
Impact
Strong Early Adoption
20+ automation developers adopted Data Fabric for production use within the first quarter - post public preview.
Increased Internal Utilization
2x increase in internal adoption rate - internal stakeholders have been using Data Fabric for their day to day tasks
Customer Enablement Success
Successfully onboarded 17 customer tenants during private preview - 11 out of these 17 customers have been actively consuming Data Fabric in their workflows post public preview